Fast and Flexible Overlap Detection for Chart Labeling with Occupancy Bitmaps
Chanwut Kittivorawong, Dominik Moritz, Kanit Wongsuphasawat, Jeffrey Heer
External link (DOI)
View presentation:2020-10-28T16:10:00ZGMT-0600Change your timezone on the schedule page
2020-10-28T16:10:00Z
Fast forward
Direct link to video on YouTube: https://youtu.be/ecfcnqToq9E
Keywords
Human-centered computing-Visualization-Visualization techniques, Human-centered computing-Visualization-Information Visualization
Abstract
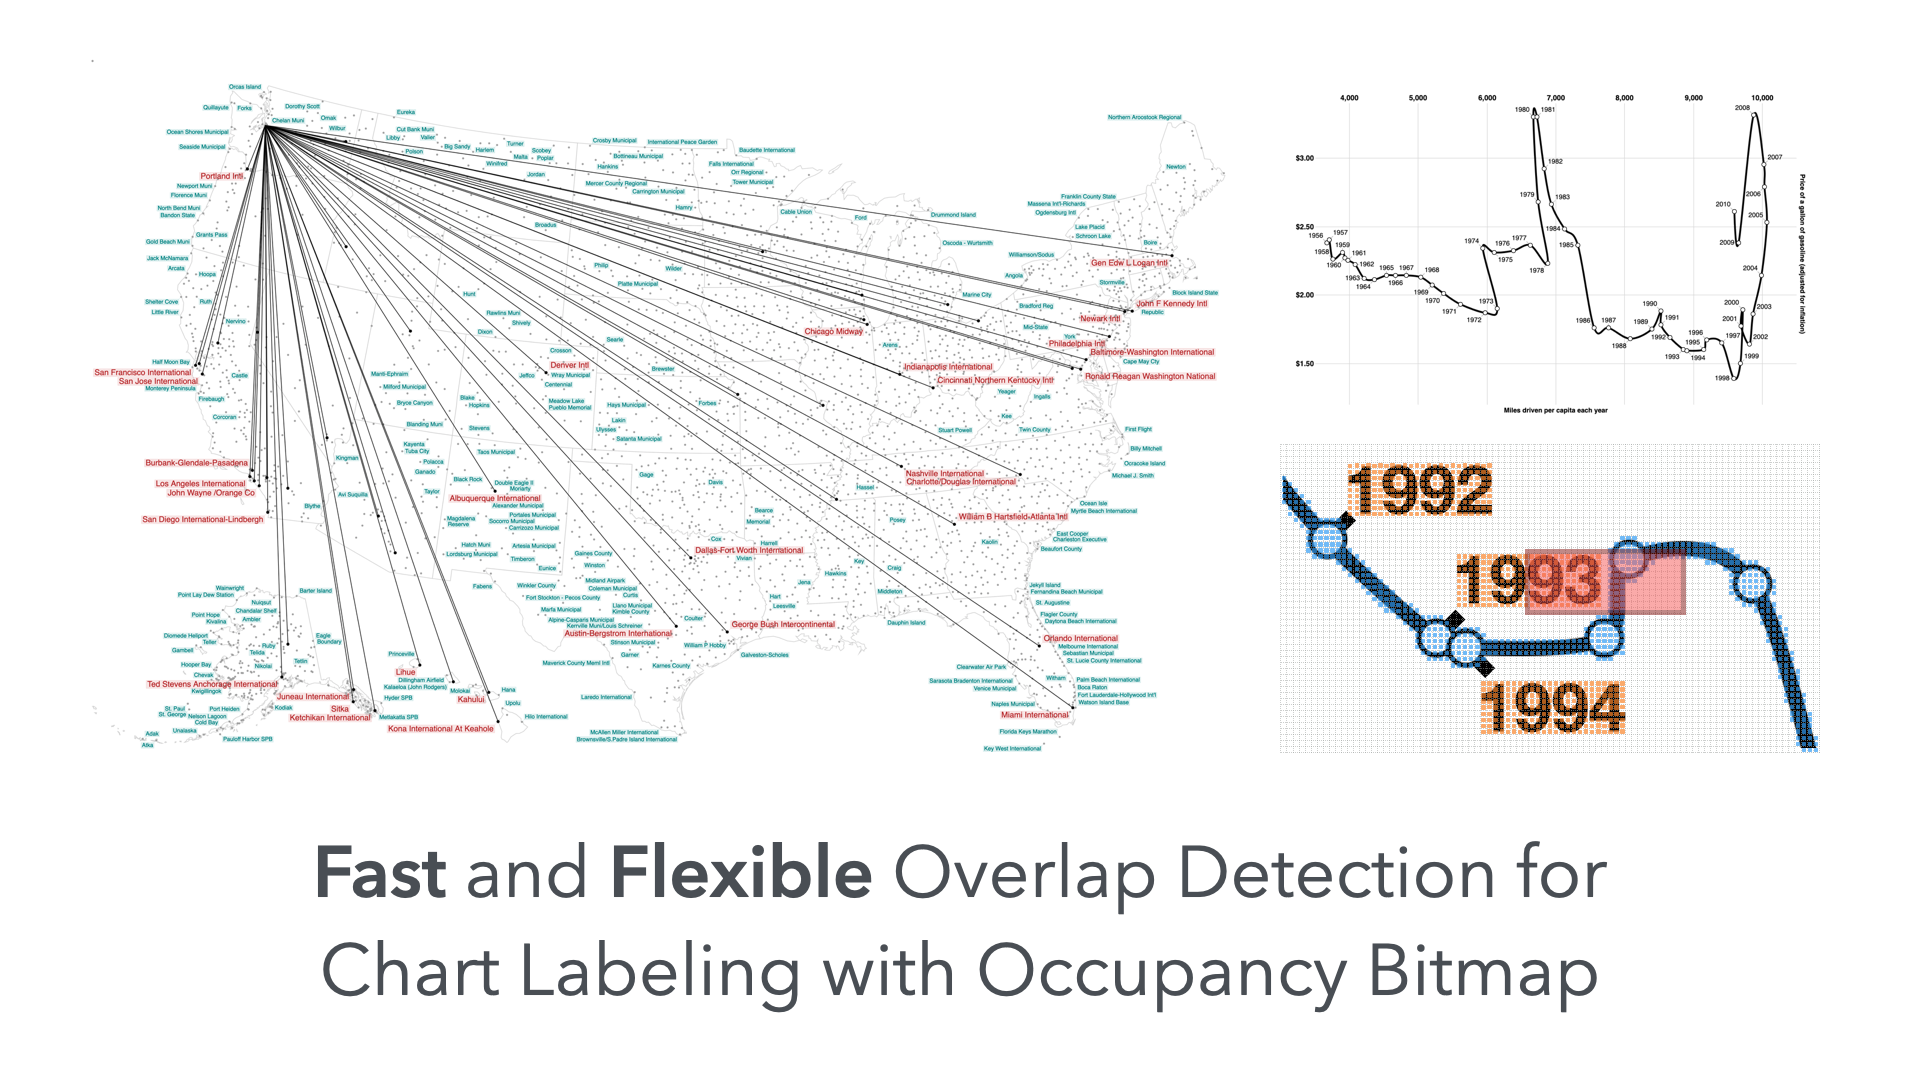
Legible labels should not overlap with other marks in a chart. The state-of-the-art labeling algorithm detects overlaps using a set of points to approximate each mark's shape. This approach is inefficient for large marks or many marks as it requires too many points to detect overlaps. In response, we present a novel label placement algorithm, which leverages occupancy bitmaps to accelerate overlap detection. To create an occupancy bitmap, we rasterize all marks onto a bitmap based on the area they occupy in the chart. It supports rasterizations of marks with any shape. With the bitmap, we can efficiently place labels without overlapping existing marks, regardless of the number and geometric complexity of the marks. Our algorithm offers significant performance improvements over the state-of-the-art approach while placing a similar number of labels.