Knowing what to look for: A Fact-Evidence Reasoning Framework for Decoding Communicative Visualization
Sahaj Vaidya, Aritra Dasgupta
External link (DOI)
View presentation:2020-10-29T16:30:00ZGMT-0600Change your timezone on the schedule page
2020-10-29T16:30:00Z
Fast forward
Direct link to video on YouTube: https://youtu.be/agtOS1kIz6w
Keywords
visual communication, decoding, human cognition, scientific charts
Abstract
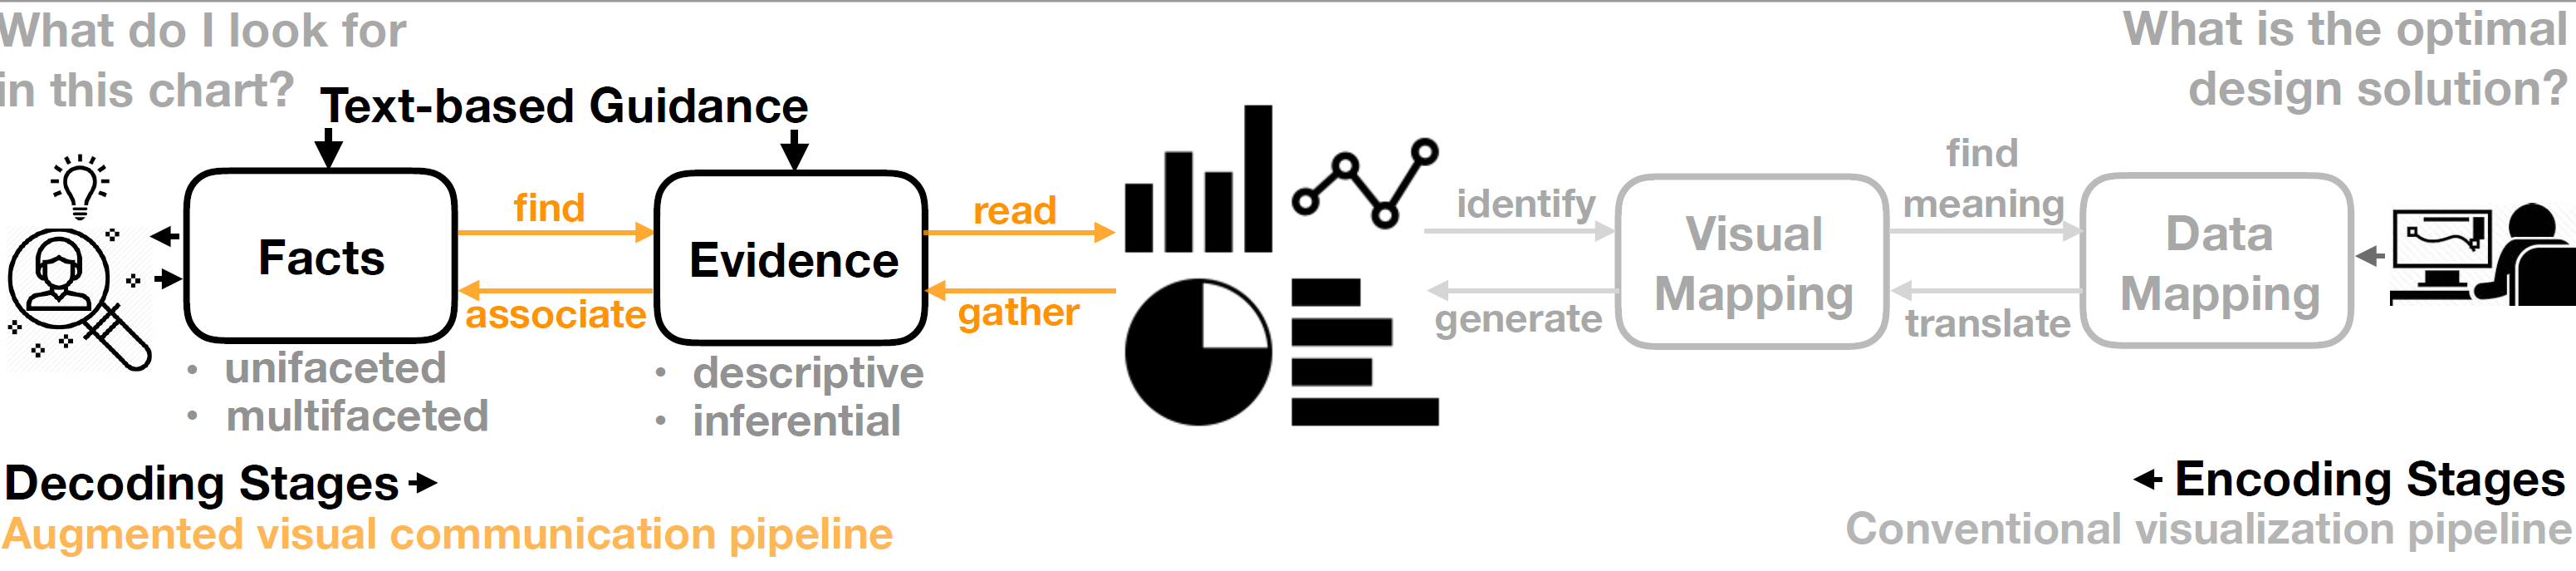
Despite the widespread use of communicative charts as a medium for scientific communication, we lack a systematic understanding of how well the charts fulfill the goals of effective visual communication. Existing research mostly focuses on the means, i.e. the encoding principles, and not the end, i.e. the key takeaway of a chart. To address this gap, we start from the first principles and aim to answer the fundamental question: how can we describe the message of a scientific chart? We contribute a fact-evidence reasoning framework (FaEvR) by augmenting the conventional visualization pipeline with the stages of gathering and associating evidence for decoding the facts presented in a chart. We apply the resulting classification scheme of fact and evidence on a collection of 500 charts collected from publications in multiple science domains. We demonstrate the practical applications of FaEvR in calibrating task complexity and detecting barriers towards chart interpretability.