Let's Gamble: How a Poor Visualization Can Elicit Risky Behavior
Melanie Bancilhon, Zhengliang Liu, Alvitta Ottley
External link (DOI)
View presentation:2020-10-29T14:50:00ZGMT-0600Change your timezone on the schedule page
2020-10-29T14:50:00Z
Fast forward
Direct link to video on YouTube: https://youtu.be/Xm1Imb6id_M
Keywords
Human-center computing - Visualization - Decision Theory - Risk Behavior - Evaluation methods
Abstract
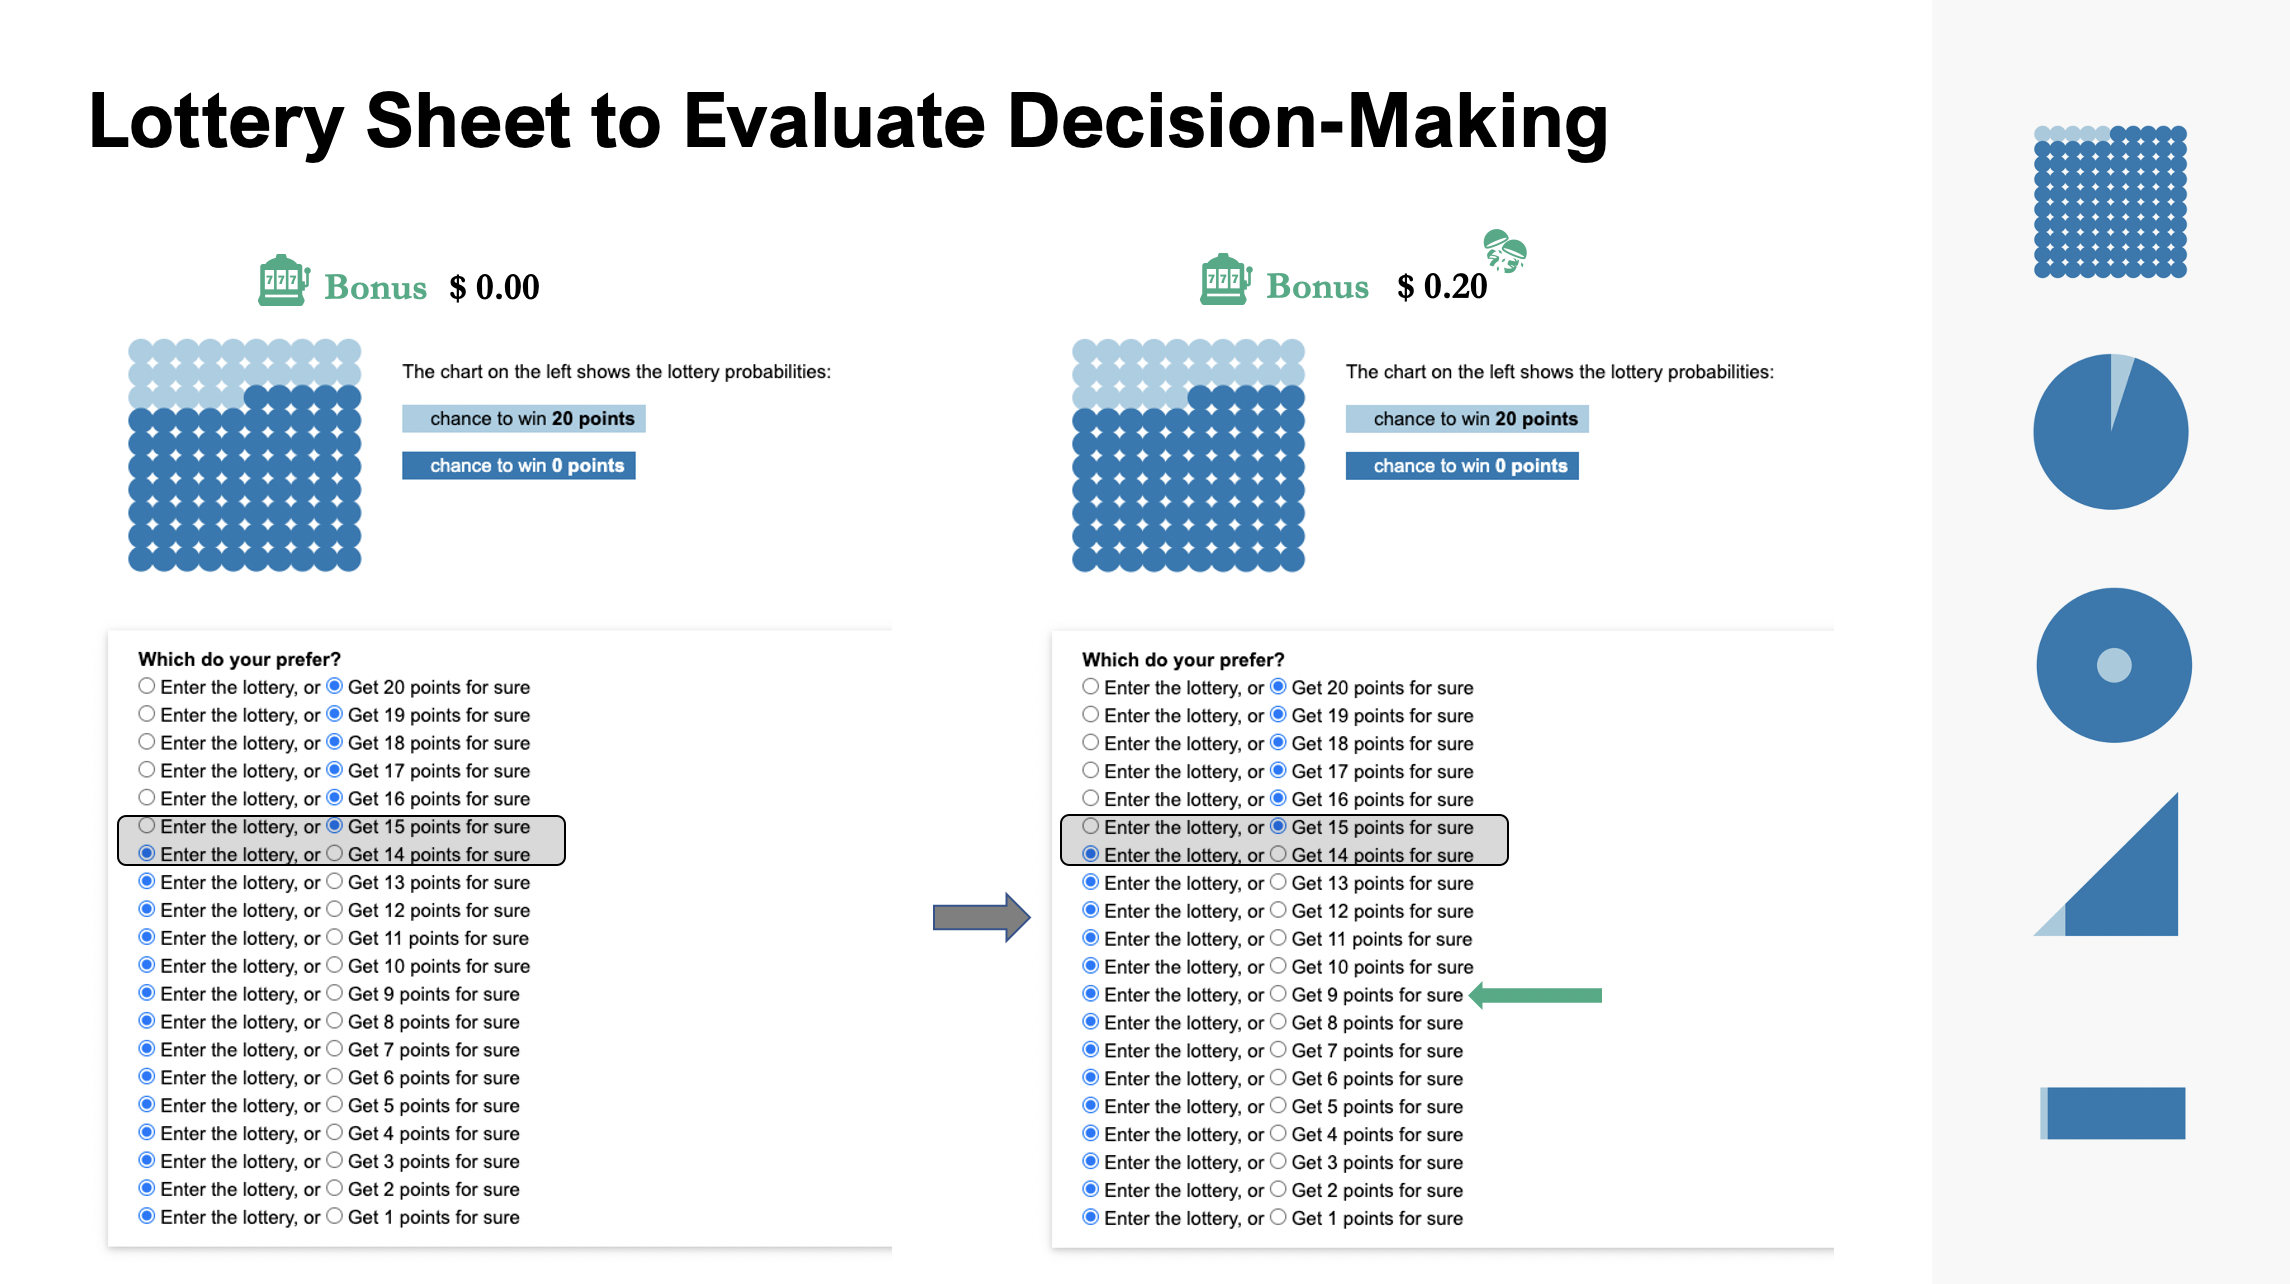
Data visualizations are standard tools for assessing and communicating risks. However, it is not always clear which designs are optimal or how encoding choices might influence risk perception and decision-making. In this paper, we report the findings of a large-scale gambling game that immersed participants in an environment where their actions impacted their bonuses. Participants chose to either enter a lottery or receive guaranteed monetary gains based on five visualization designs. By measuring risk perception and observing decision-making, we present suggestive evidence that people were more likely to gamble when presented area proportioned triangle and circle designs. Using our results, we model risk perception and discuss how our findings can improve visualization selection.