Exploring How Personality Models Information Visualization Preferences
Tomás Alves, Bárbara Ramalho, Joana Henriques-Calado, Daniel Gonçalves, Sandra Gama
External link (DOI)
View presentation:2020-10-29T15:00:00ZGMT-0600Change your timezone on the schedule page
2020-10-29T15:00:00Z

Fast forward
Direct link to video on YouTube: https://youtu.be/0WA4AFBrYL0
Keywords
Human-centeredcomputing-Humancomputerin- teraction (HCI)-HCI design and evaluation methods-User studies, Human-centered computing-Visualization-Visualization design and evaluation methods
Abstract
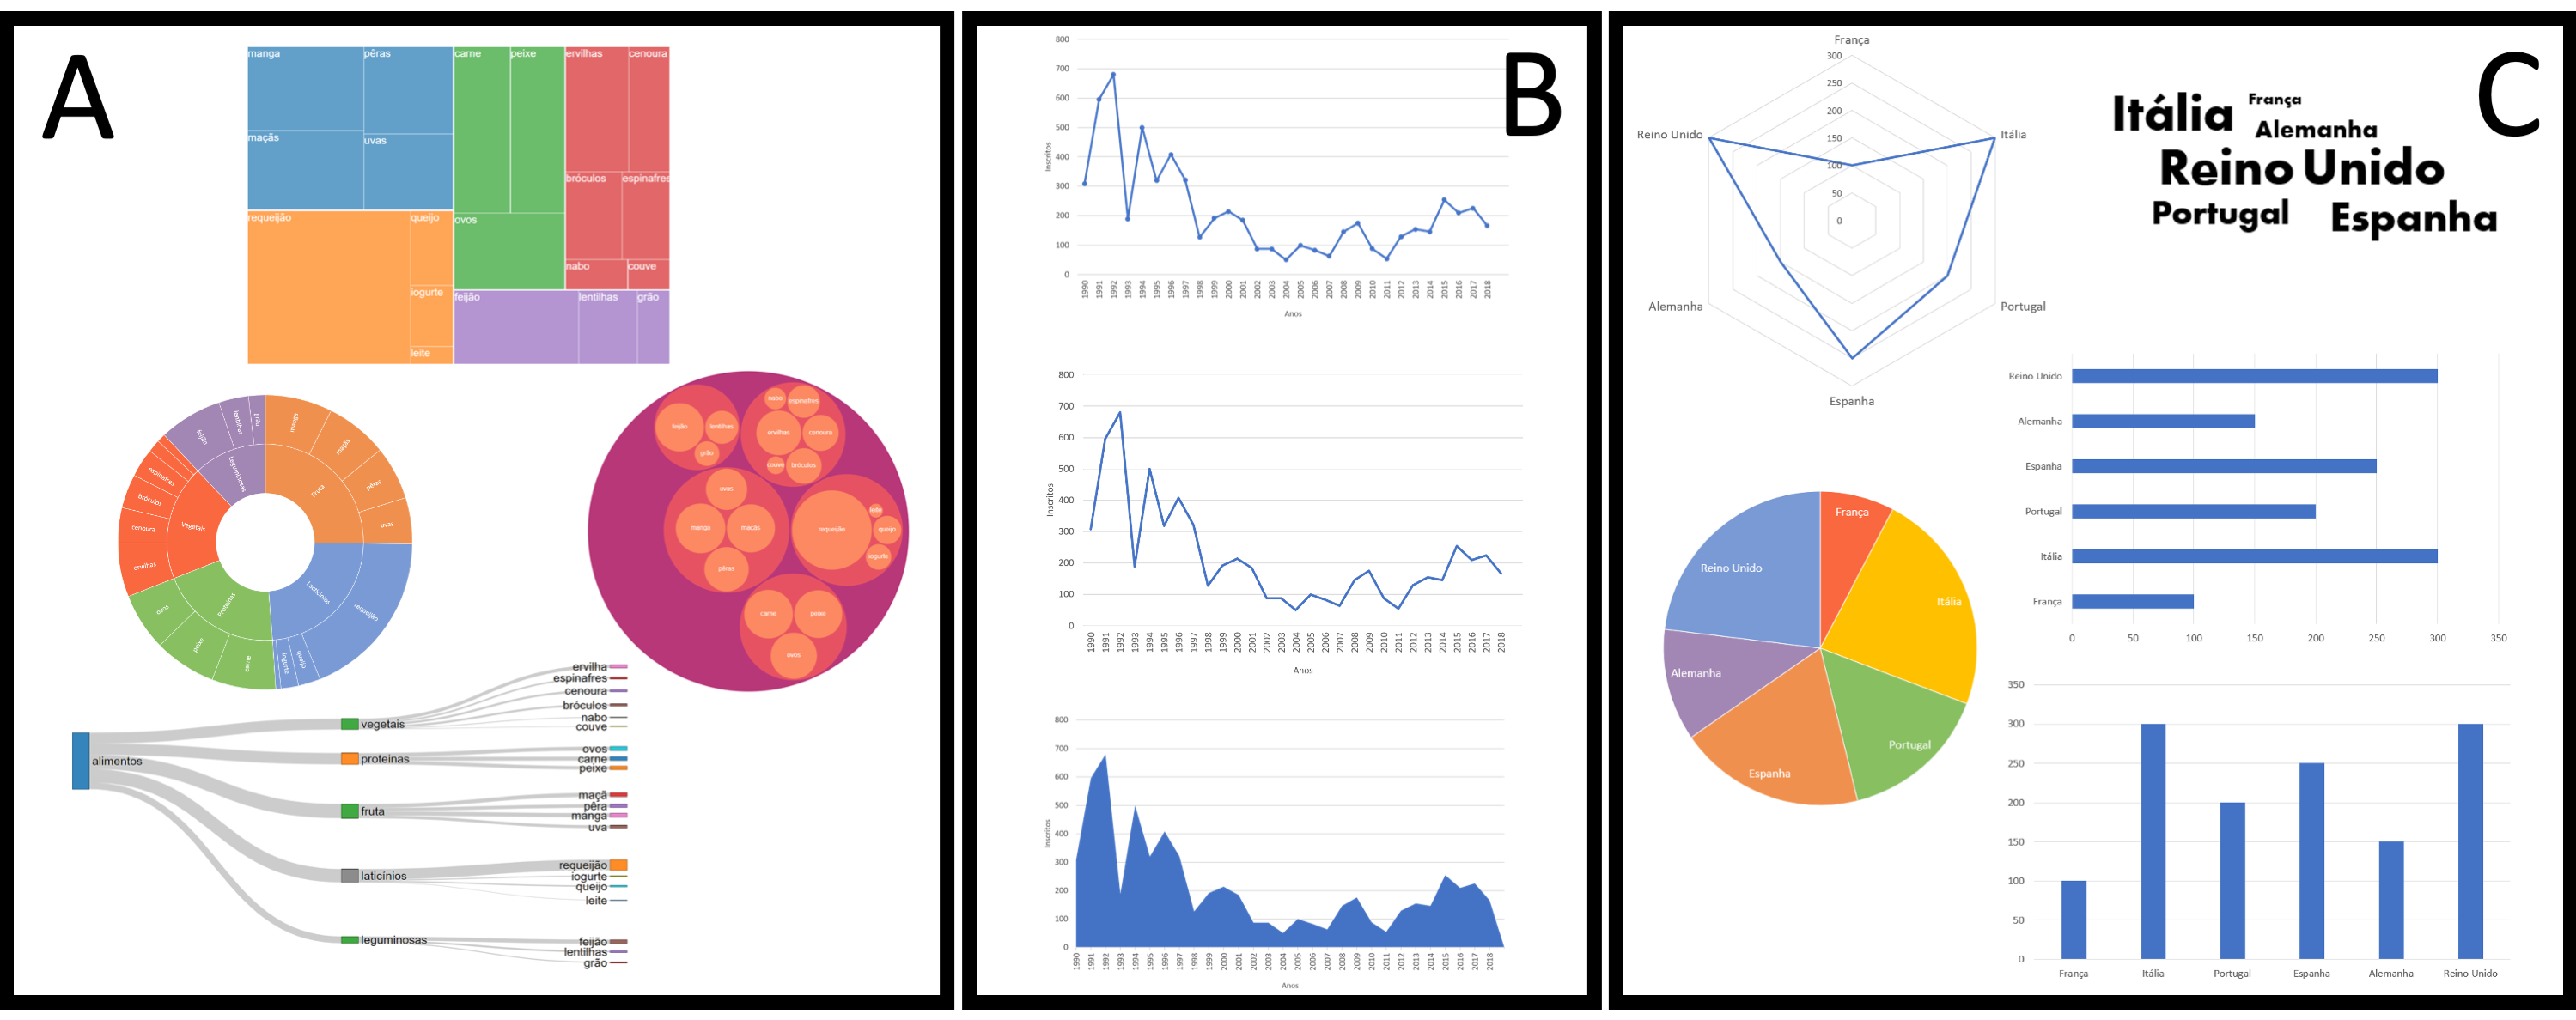
Recent research on information visualization has shown how individual differences act as a mediator on how users interact with visualization systems. We focus our exploratory study on whether personality has an effect on user preferences regarding idioms used for hierarchy, evolution over time, and comparison contexts. Specifically, we leverage all personality variables from the Five-Factor Model and the three dimensions from Locus of Control (LoC) with correlation and clustering approaches. The correlation-based method suggested that Neuroticism, Openness to Experience, Agreeableness, several facets from each trait, and the External dimensions from LoC mediate how much individuals prefer certain idioms. In addition, our results from the cluster-based analysis showed that Neuroticism, Extraversion, Conscientiousness, and all dimensions from LoC have an effect on preferences for idioms in hierarchy and evolution contexts. Our results support the incorporation of in-depth personality synergies with InfoVis into the design pipeline of visualization systems.