Data Visualization Practitioners' Perspectives on Chartjunk
Paul Parsons, Prakash Chandra Shukla
External link (DOI)
View presentation:2020-10-29T15:20:00ZGMT-0600Change your timezone on the schedule page
2020-10-29T15:20:00Z
Fast forward
Direct link to video on YouTube: https://youtu.be/3LTjlsVAgpw
Keywords
Index Terms: Human-centered computing-Visualization,
Abstract
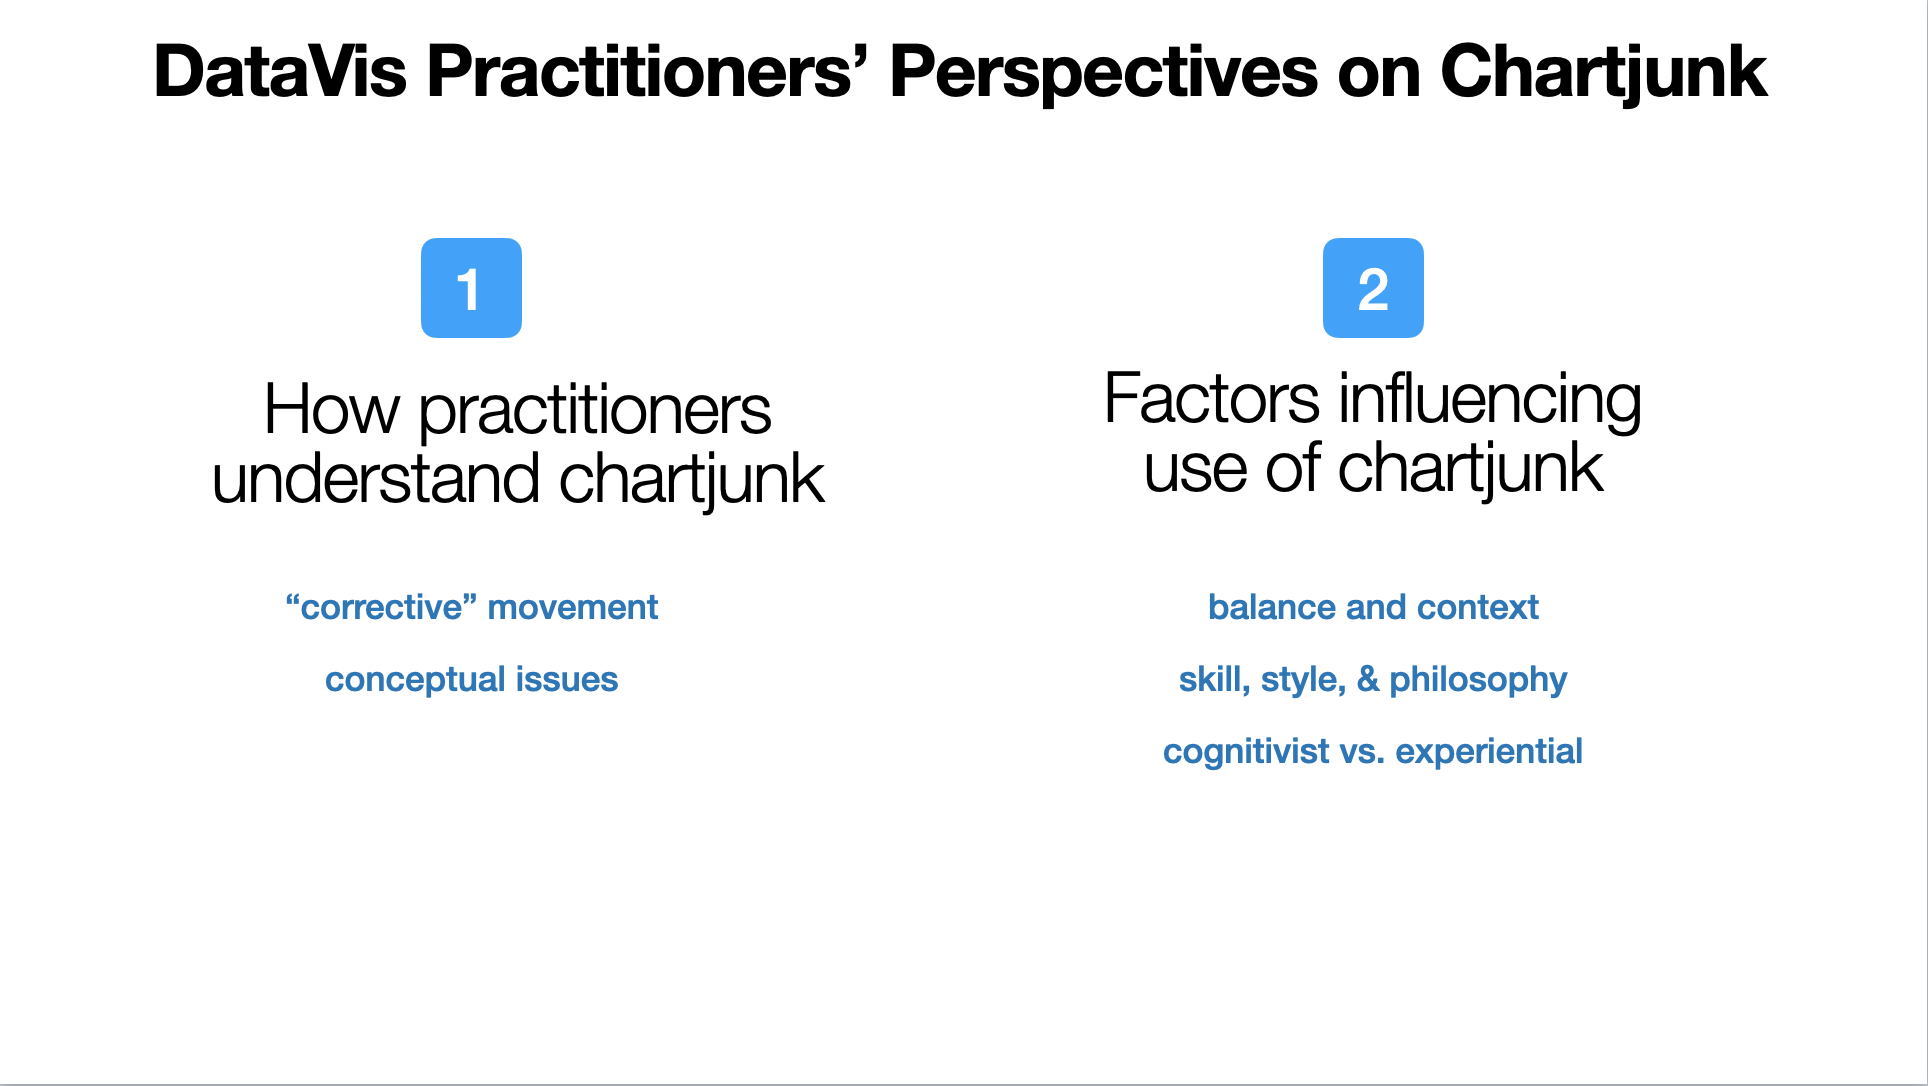
Chartjunk is a popular yet contentious topic. In recent years it has seen increasing research interest, with studies investigating phenomena such as memorability, engagement, preference, and performance. These studies have shown that extreme minimalism is not always best, and that visual embellishments can be useful depending on the context. While more knowledge is being developed regarding the effects of embellishments on users, less attention has been given to the perspectives of practitioners regarding how they design with embellishments. We conducted semi-structured interviews with 20 data visualization practitioners, investigating how they understand chartjunk and the factors that influence how and when they make use of embellishments. Our analysis uncovers a broad and pluralistic understanding of chartjunk among practitioners, and foregrounds a variety of personal and situated factors that influence the use of chartjunk beyond mere context. We highlight the personal nature of design practice, and discuss the need for more practice-led visualization research to better understand the ways in which concepts like chartjunk are interpreted and used by practitioners.