Visual Evaluation for Autonomous Driving
Yijie Hou, Chengshun Wang, Junhong Wang, Xiangyang Xue, Xiaolong Zhang, Jun Zhu, Dongliang Wang, Siming Chen
External link (DOI)
View presentation:2021-10-28T15:15:00ZGMT-0600Change your timezone on the schedule page
2021-10-28T15:15:00Z
Fast forward
Direct link to video on YouTube: https://youtu.be/r2DuL5JMX_0
Abstract
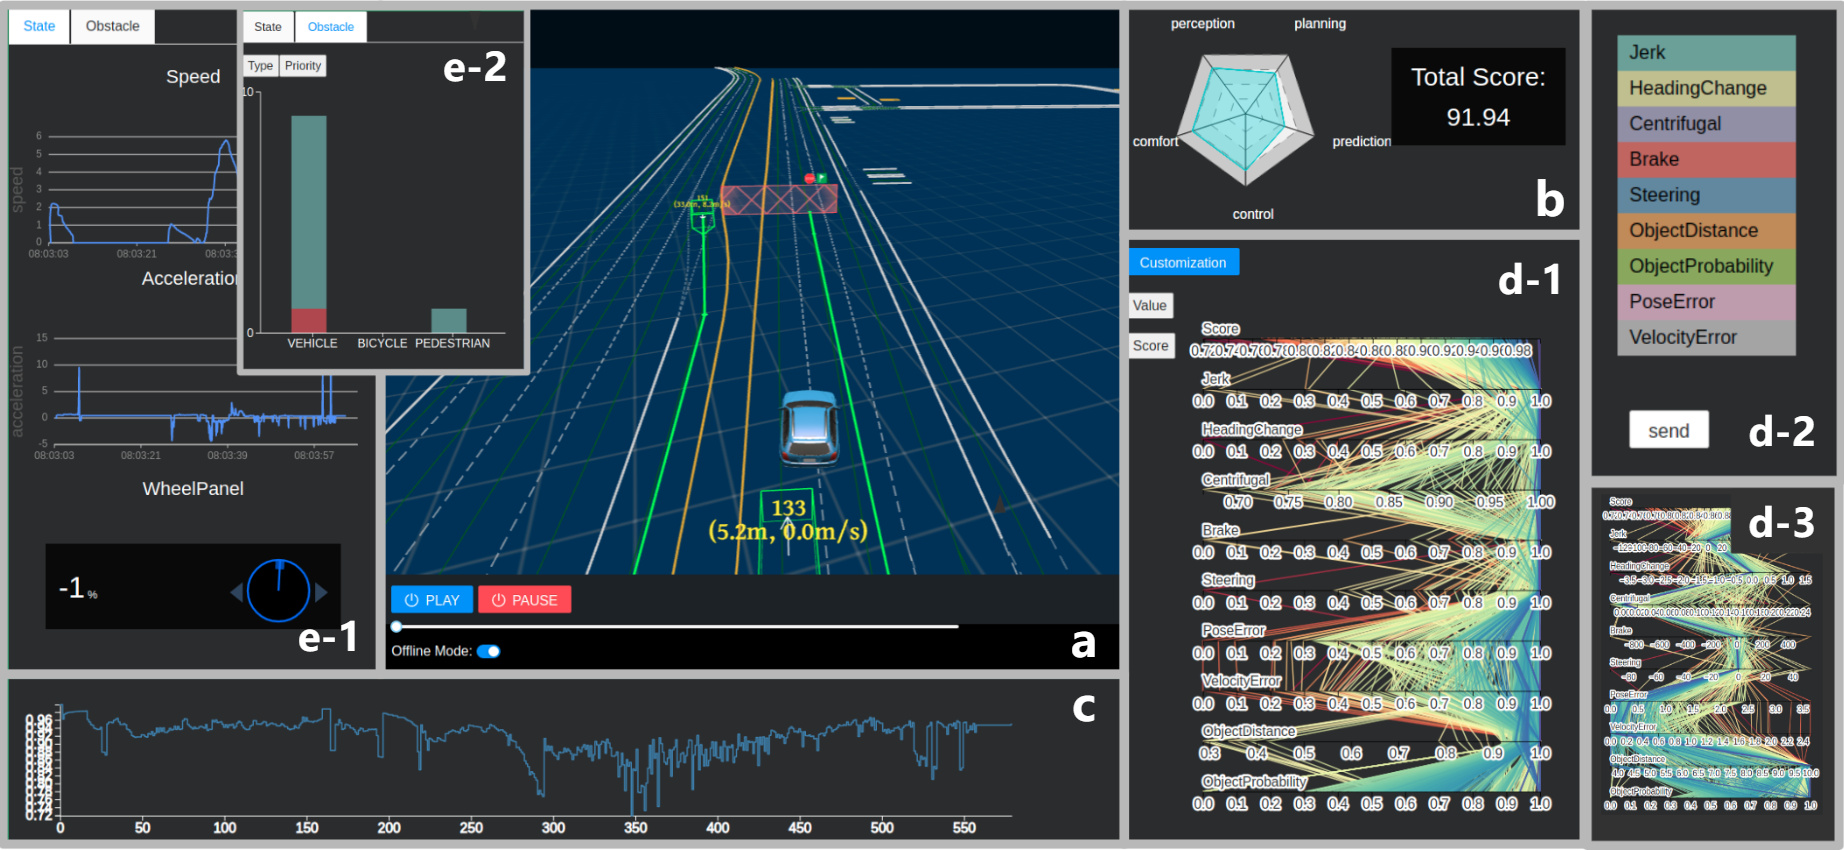
Autonomous driving technologies often use state-of-the-art artificial intelligence algorithms to understand the relationship between the vehicle and the external environment, to predict the changes of the environment, and then to plan and control the behaviors of the vehicle accordingly. The complexity of such technologies makes it challenging to evaluate the performance of autonomous driving systems and to find ways to improve them. The current approaches to evaluating such autonomous driving systems largely use a single score to indicate the overall performance of a system, but domain experts have difficulties in understanding how individual components or algorithms in an autonomous driving system may contribute to the score. To address this problem, we collaborate with domain experts on autonomous driving algorithms, and propose a visual evaluation method for autonomous driving. Our method considers the data generated in all components during the whole process of autonomous driving, including perception results, planning routes, prediction of obstacles, various controlling parameters, and evaluation of comfort. We develop a visual analytics workflow to integrate an evaluation mathematical model with adjustable parameters, support the evaluation of the system from the level of the overall performance to the level of detailed measures of individual components, and to show both evaluation scores and their contributing factors. Our implemented visual analytics system provides an overview evaluation score at the beginning and shows the animation of the dynamic change of the scores at each period. Experts can interactively explore the specific component at different time periods and identify related factors. With our method, domain experts not only learn about the performance of an autonomous driving system, but also identify and access the problematic parts of each component. Our visual evaluation system can be applied to the autonomous driving simulation system and used for various evaluation cases. The results of using our system in some simulation cases and the feedback from involved domain experts confirm the usefulness and efficiency of our method in helping people gain in-depth insight into autonomous driving systems.