Exploring the Representation of Cyber-Risk Data Through Sketching
Thomas Miller, Miriam Sturdee, Daniel Prince
Room: 101-102
2023-10-22T03:00:00ZGMT-0600Change your timezone on the schedule page
2023-10-22T03:00:00Z
Abstract
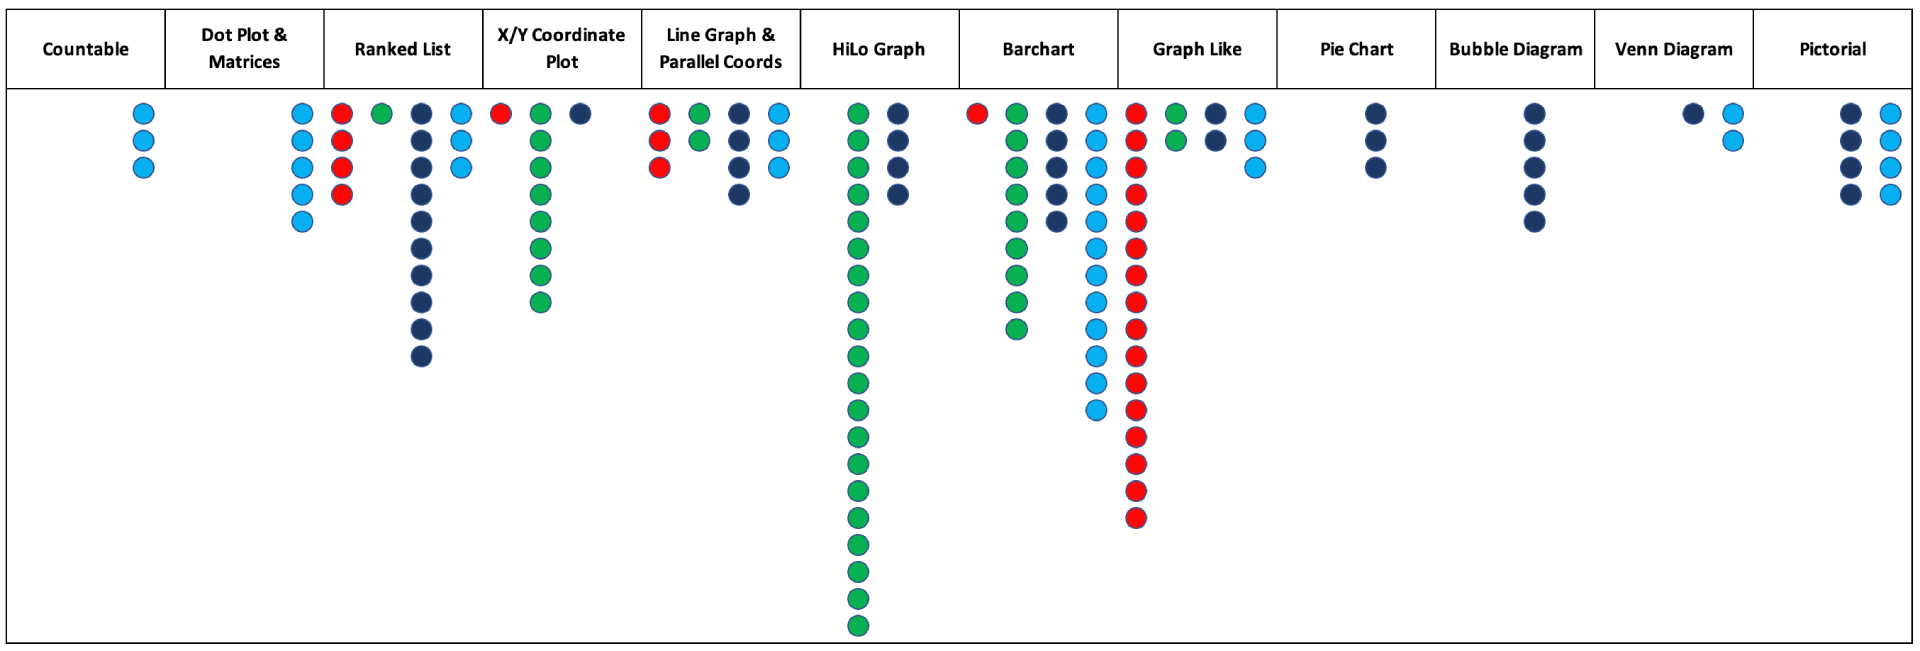
Dealing with complex information regarding cyber security risks is increasingly important as attacks rise in frequency. Visualisation techniques are used to support decision-making and insight. However, the use of visualisations across different stakeholders and cyber security risk data is not well explored. This work presents an exploratory study in which participants use sketching to represent cyber-risk data. We critically discuss the method and our results demonstrate the usefulness of the method to identify new, diverse visualisation approaches, as well as the richness of stakeholder visualisation conceptualisation.