Aardvark: Comparative Visualization of Data Analysis Scripts
Rebecca Faust, Carlos Scheidegger, Chris North
Room: 106
2023-10-23T03:00:00ZGMT-0600Change your timezone on the schedule page
2023-10-23T03:00:00Z
Fast forward
Full Video
Abstract
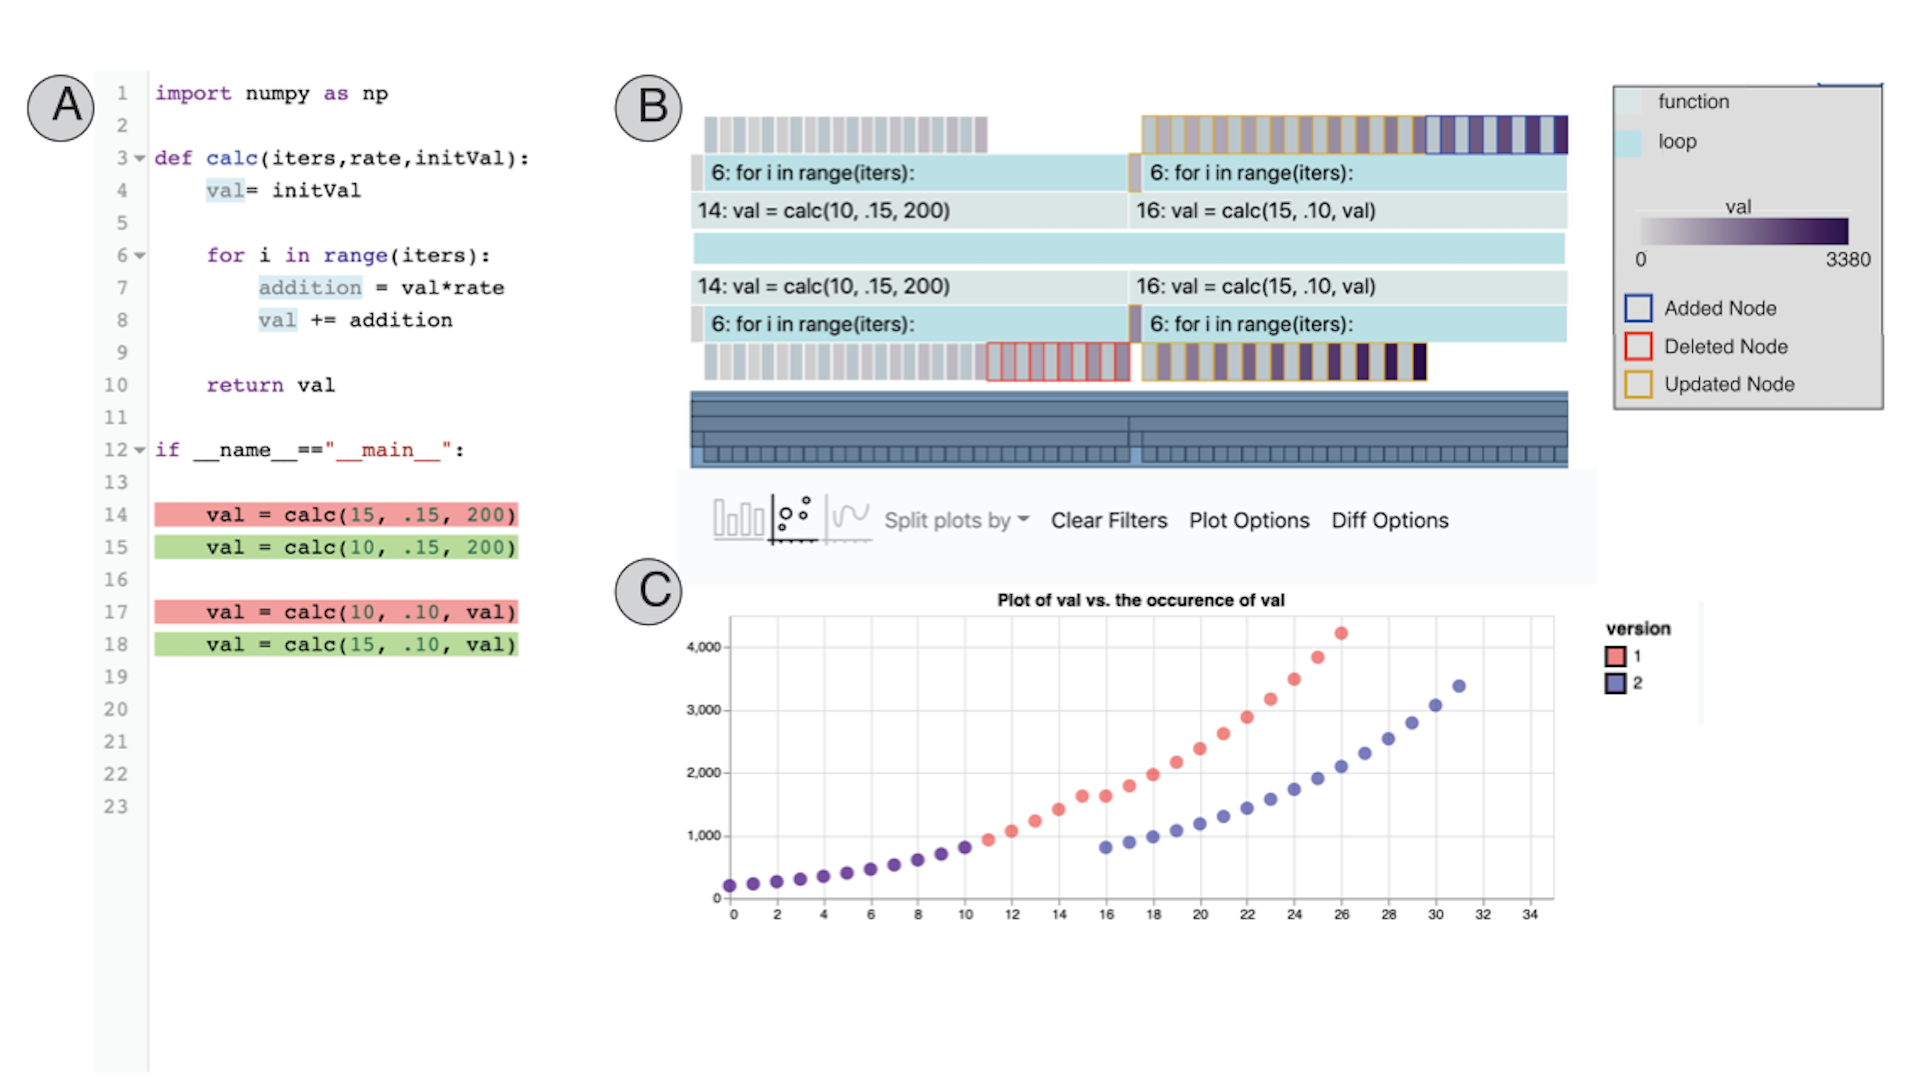
Debugging programs is famously one of the most challenging aspects of programming. Data analysis scripts present additional challenges as debugging tasks are often more exploratory, such as comparing results under different parameter settings. In fact, a common exploratory debugging process is to run, modify, and re-run a script to observe the effects of the change. Analyst’s perform this process repeatedly as they explore different settings in their script. However, traditional debugging methods do not support direct comparison across script executions. To address this, we present Aardvark, a comparative trace-based debugging method for identifying and visualizing the differences between consecutive executions of analysis scripts. Aardvark traces two consecutive instances of a script, identifies the differences between them, and presents them through comparative visualizations. We present a prototype implementation in Python along with an extension to Jupyter notebooks and demonstrate Aardvark through two usage scenarios on real world analysis scripts.