SUBPLEX: A Visual Analytics Approach to Understand Local Model Explanations at the Subpopulation Level
Jun Yuan, Gromit Yeuk-Yin Chan, Brian Barr, Kyle Overton, Kim Rees, Luis Gustavo Nonato, Enrico Bertini, Claudio Silva
Room: 104
2023-10-25T00:21:00ZGMT-0600Change your timezone on the schedule page 2023-10-25T00:21:00Z
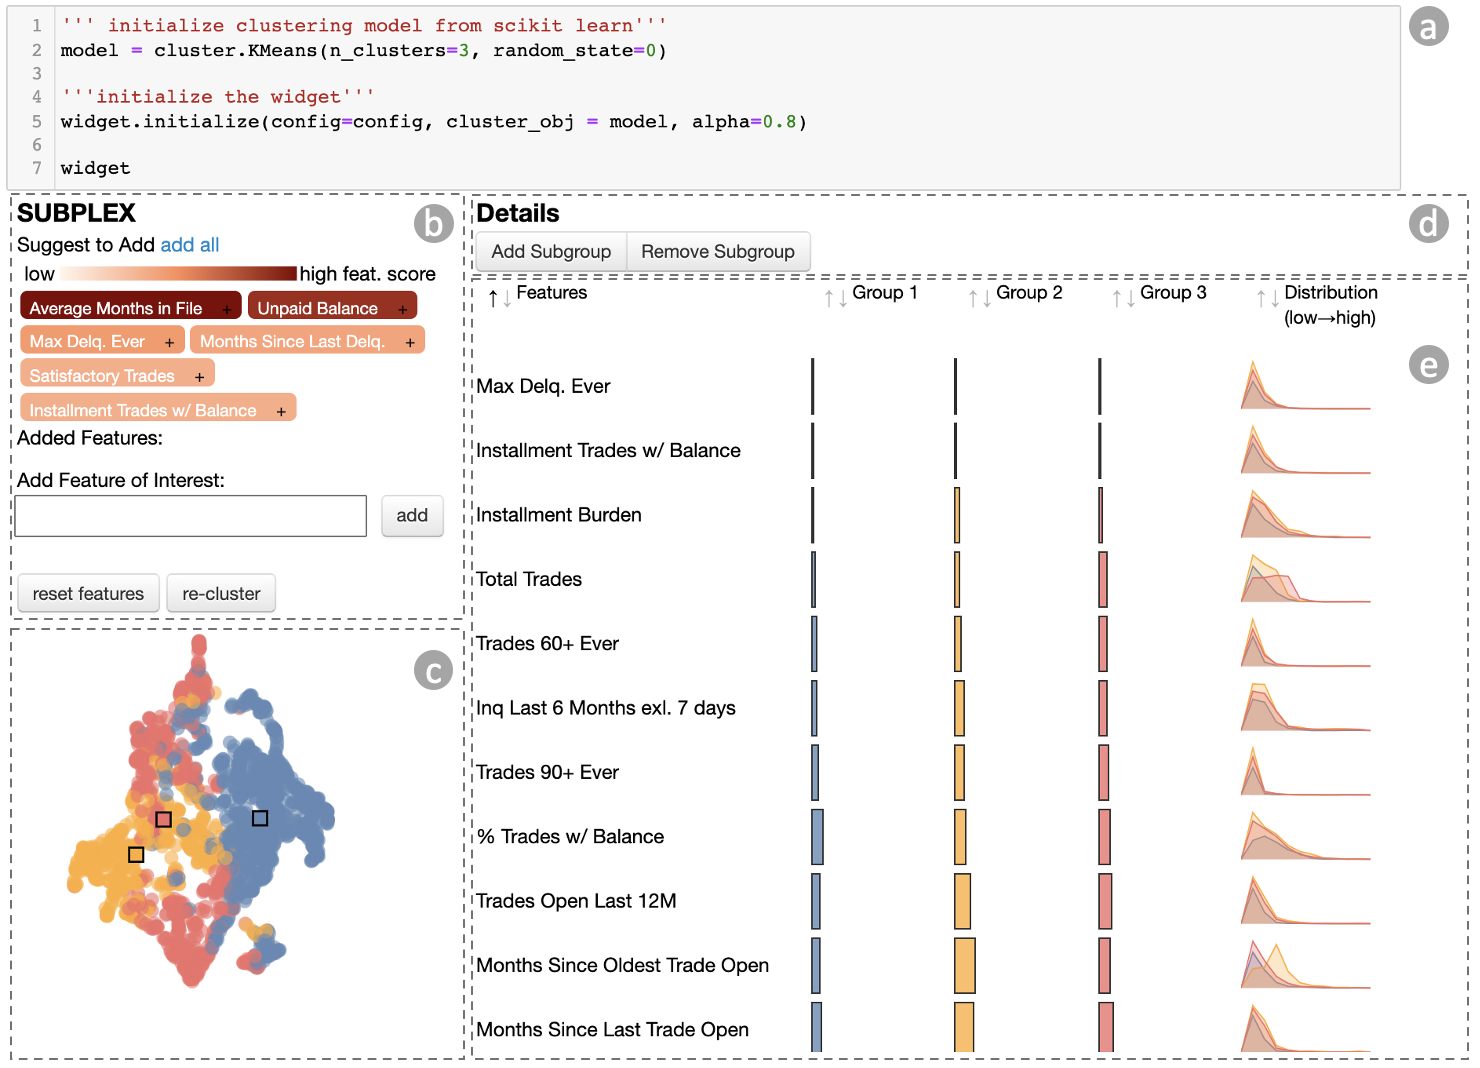
SUBPLEX is a visual analytics tool in Jupyter notebook to assist data scientist to understand local model explanations at the subpopulation level. SUBPLEX contains five linked views: (a) code block, (b) cluster refinement view, (c) projection view, (d) subpopulation creation panel, (e) local explanation detail view.