EmphasisChecker: A Tool for Guiding Chart and Caption Emphasis
Dae Hyun Kim, Seulgi Choi, Juho Kim, Vidya Setlur, Maneesh Agrawala
DOI: 10.1109/TVCG.2023.3327150
Room: 105
2023-10-24T22:48:00ZGMT-0600Change your timezone on the schedule page
2023-10-24T22:48:00Z
Fast forward
Full Video
Keywords
Chart and text takeaways, visual prominence, authoring, captions
Abstract
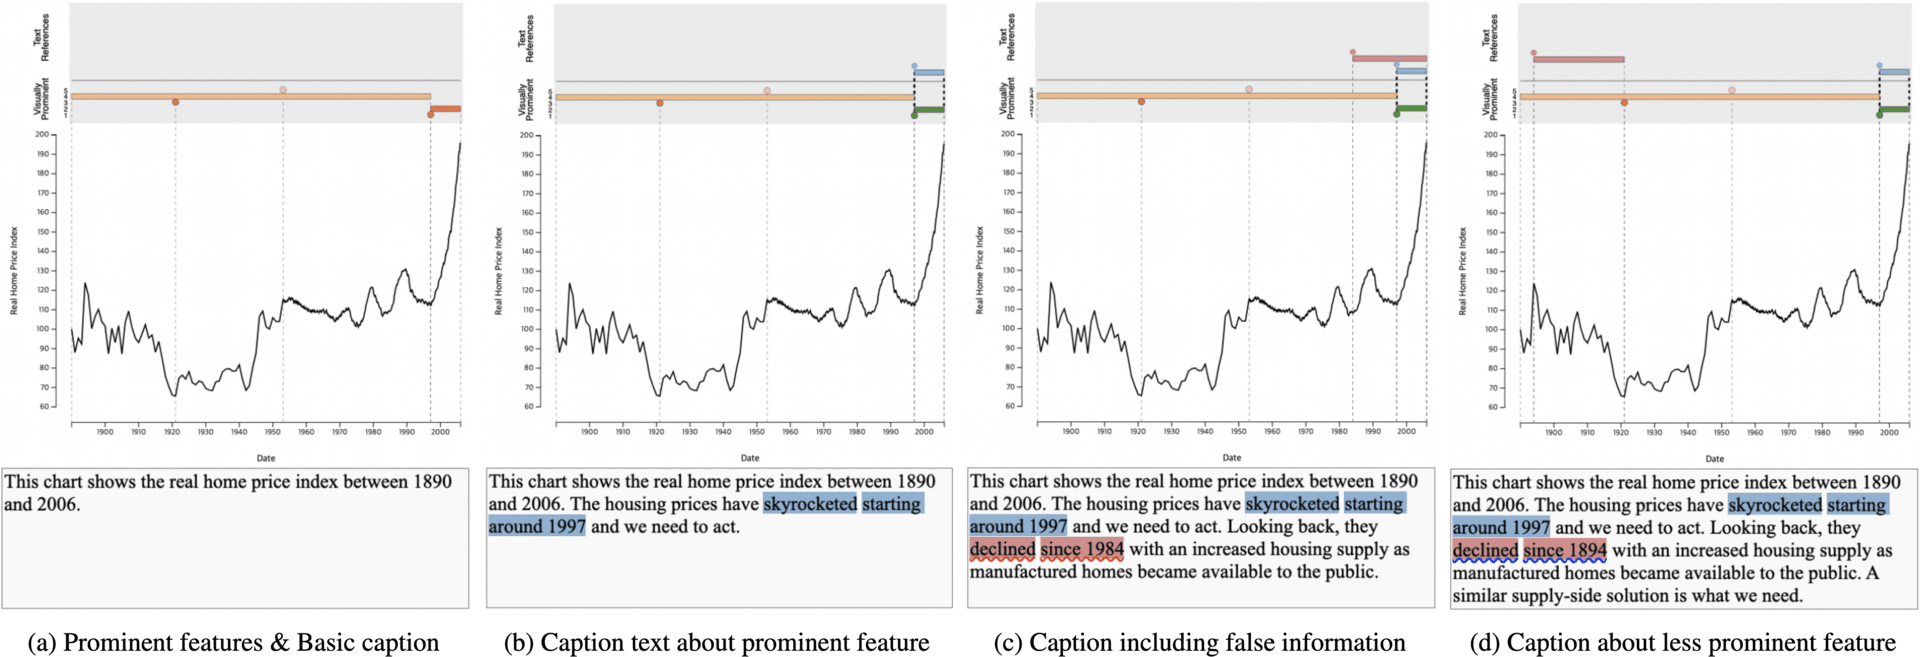
Recent work has shown that when both the chart and caption emphasize the same aspects of the data, readers tend to remember the doubly-emphasized features as takeaways; when there is a mismatch, readers rely on the chart to form takeaways and can miss information in the caption text. Through a survey of 280 chart-caption pairs in real-world sources (e.g., news media, poll reports, government reports, academic articles, and Tableau Public), we find that captions often do not emphasize the same information in practice, which could limit how effectively readers take away the authors’ intended messages. Motivated by the survey findings, we present EmphasisChecker, an interactive tool that highlights visually prominent chart features as well as the features emphasized by the caption text along with any mismatches in the emphasis. The tool implements a time-series prominent feature detector based on the Ramer-Douglas-Peucker algorithm and a text reference extractor that identifies time references and data descriptions in the caption and matches them with chart data. This information enables authors to compare features emphasized by these two modalities, quickly see mismatches, and make necessary revisions. A user study confirms that our tool is both useful and easy to use when authoring charts and captions.