Let the Chart Spark: Embedding Semantic Context into Chart with Generative Model
Shishi Xiao, Suizi Huang, Yue LIN, Yilin Ye, Wei Zeng
DOI: 10.1109/TVCG.2023.3326913
Room: 106
2023-10-25T00:33:00ZGMT-0600Change your timezone on the schedule page
2023-10-25T00:33:00Z
Fast forward
Full Video
Keywords
pictorial visualization, generative model, authoring tool
Abstract
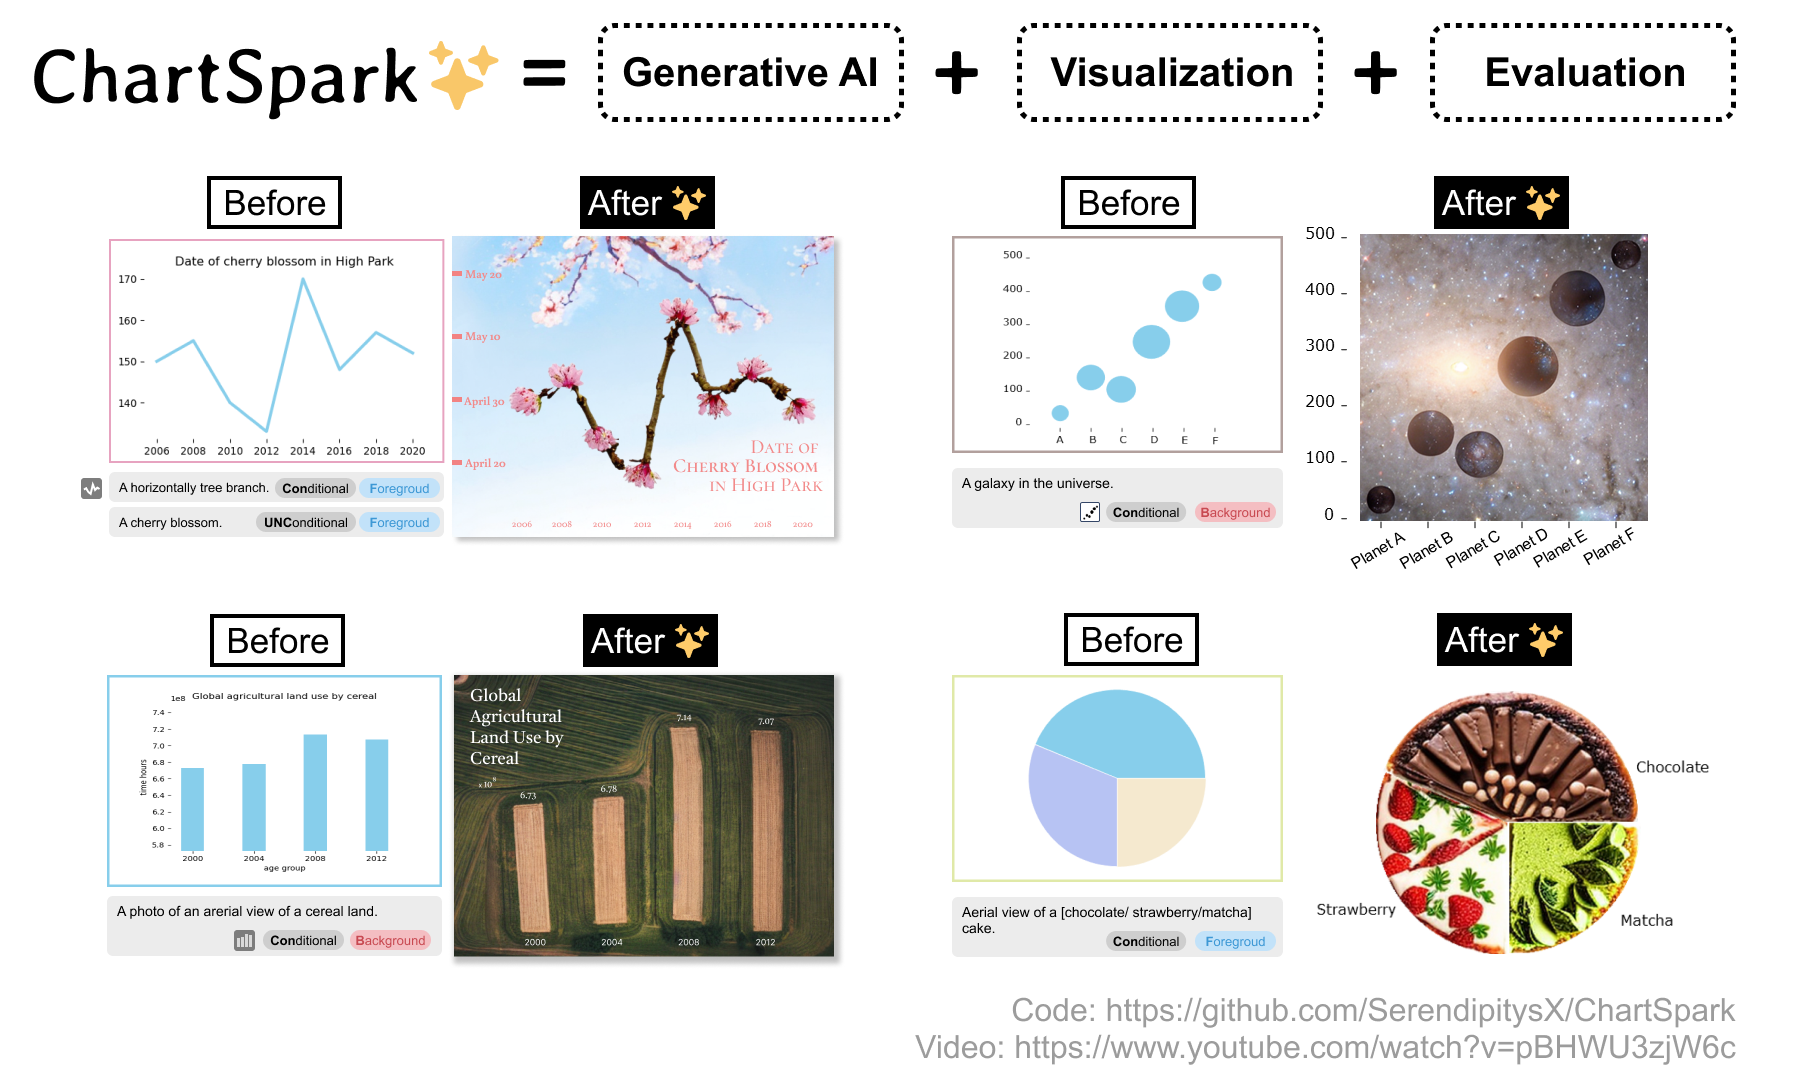
Pictorial visualization seamlessly integrates data and semantic context into visual representation, conveying complex information in an engaging and informative manner. Extensive studies have been devoted to developing authoring tools to simplify the creation of pictorial visualizations. However, mainstream works follow a retrieving-and-editing pipeline that heavily relies on retrieved visual elements from a dedicated corpus, which often compromise data integrity. Text-guided generation methods are emerging, but may have limited applicability due to its predefined entities. In this work, we propose ChartSpark, a novel system that embeds semantic context into chart based on text-to-image generative model. ChartSpark generates pictorial visualizations conditioned on both semantic context conveyed in textual inputs and data information embedded in plain charts. The method is generic for both foreground and background pictorial generation, satisfying the design practices identified from an empirical research into existing pictorial visualizations. We further develop an interactive visual interface that integrates a text analyzer, editing module, and evaluation module to enable users to generate, modify, and assess pictorial visualizations. We experimentally demonstrate the usability of our tool, and conclude with a discussion of the potential of using text-to-image generative model combined with interactive interface for visualization design.