Visual Analytics for Understanding Draco's Knowledge Base
Johanna Schmidt, Bernhard Pointner, Silvia Miksch
DOI: 10.1109/TVCG.2023.3326912
Room: 105
2023-10-25T03:00:00ZGMT-0600Change your timezone on the schedule page
2023-10-25T03:00:00Z
Fast forward
Full Video
Keywords
Visual Analytics, Hypergraph visualization, Rule-based recommendation systems
Abstract
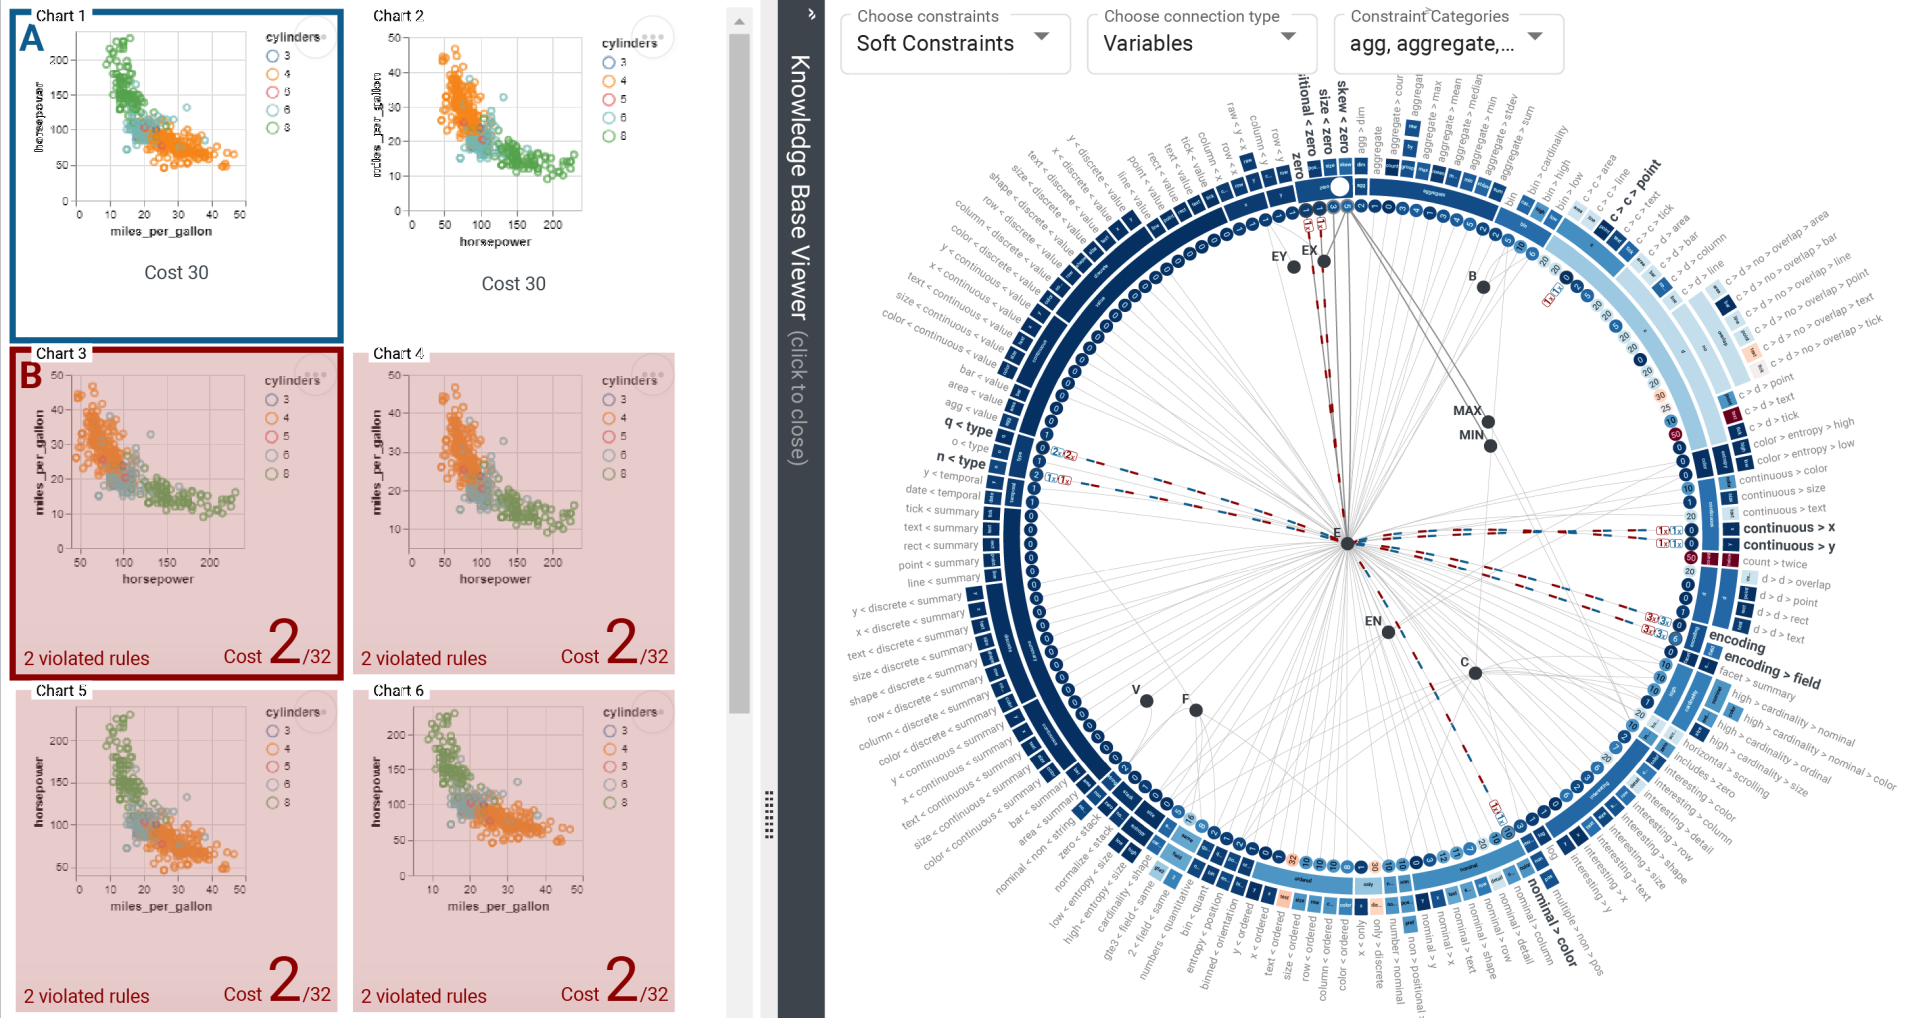
Draco has been developed as an automated visualization recommendation system formalizing design knowledge as logical constraints in ASP (Answer-Set Programming). With an increasing set of constraints and incorporated design knowledge, even visualization experts lose overview in Draco and struggle to retrace the automated recommendation decisions made by the system. Our paper proposes an Visual Analytics (VA) approach to visualize and analyze Draco's constraints. Our VA approach is supposed to enable visualization experts to accomplish identified tasks regarding the knowledge base and support them in better understanding Draco. We extend the existing data extraction strategy of Draco with a data processing architecture capable of extracting features of interest from the knowledge base. A revised version of the ASP grammar provides the basis for this data processing strategy. The resulting incorporated and shared features of the constraints are then visualized using a hypergraph structure inside the radial-arranged constraints of the elaborated visualization. The hierarchical categories of the constraints are indicated by arcs surrounding the constraints. Our approach is supposed to enable visualization experts to interactively explore the design rules' violations based on highlighting respective constraints or recommendations. A qualitative and quantitative evaluation of the prototype confirms the prototype's effectiveness and value in acquiring insights into Draco's recommendation process and design constraints.