QEVIS: Multi-grained Visualizing of Distributed Query Execution
Qiaomu Shen, Zhengxin You, Xiao Yan, Chaozu Zhang, Ke Xu, Jianbin Qin, Dan Zeng, Bo Tang
DOI: 10.1109/TVCG.2023.3326930
Room: 106
2023-10-24T22:12:00ZGMT-0600Change your timezone on the schedule page
2023-10-24T22:12:00Z
Fast forward
Full Video
Keywords
visual analytics system, distributed query execution, performance analysis
Abstract
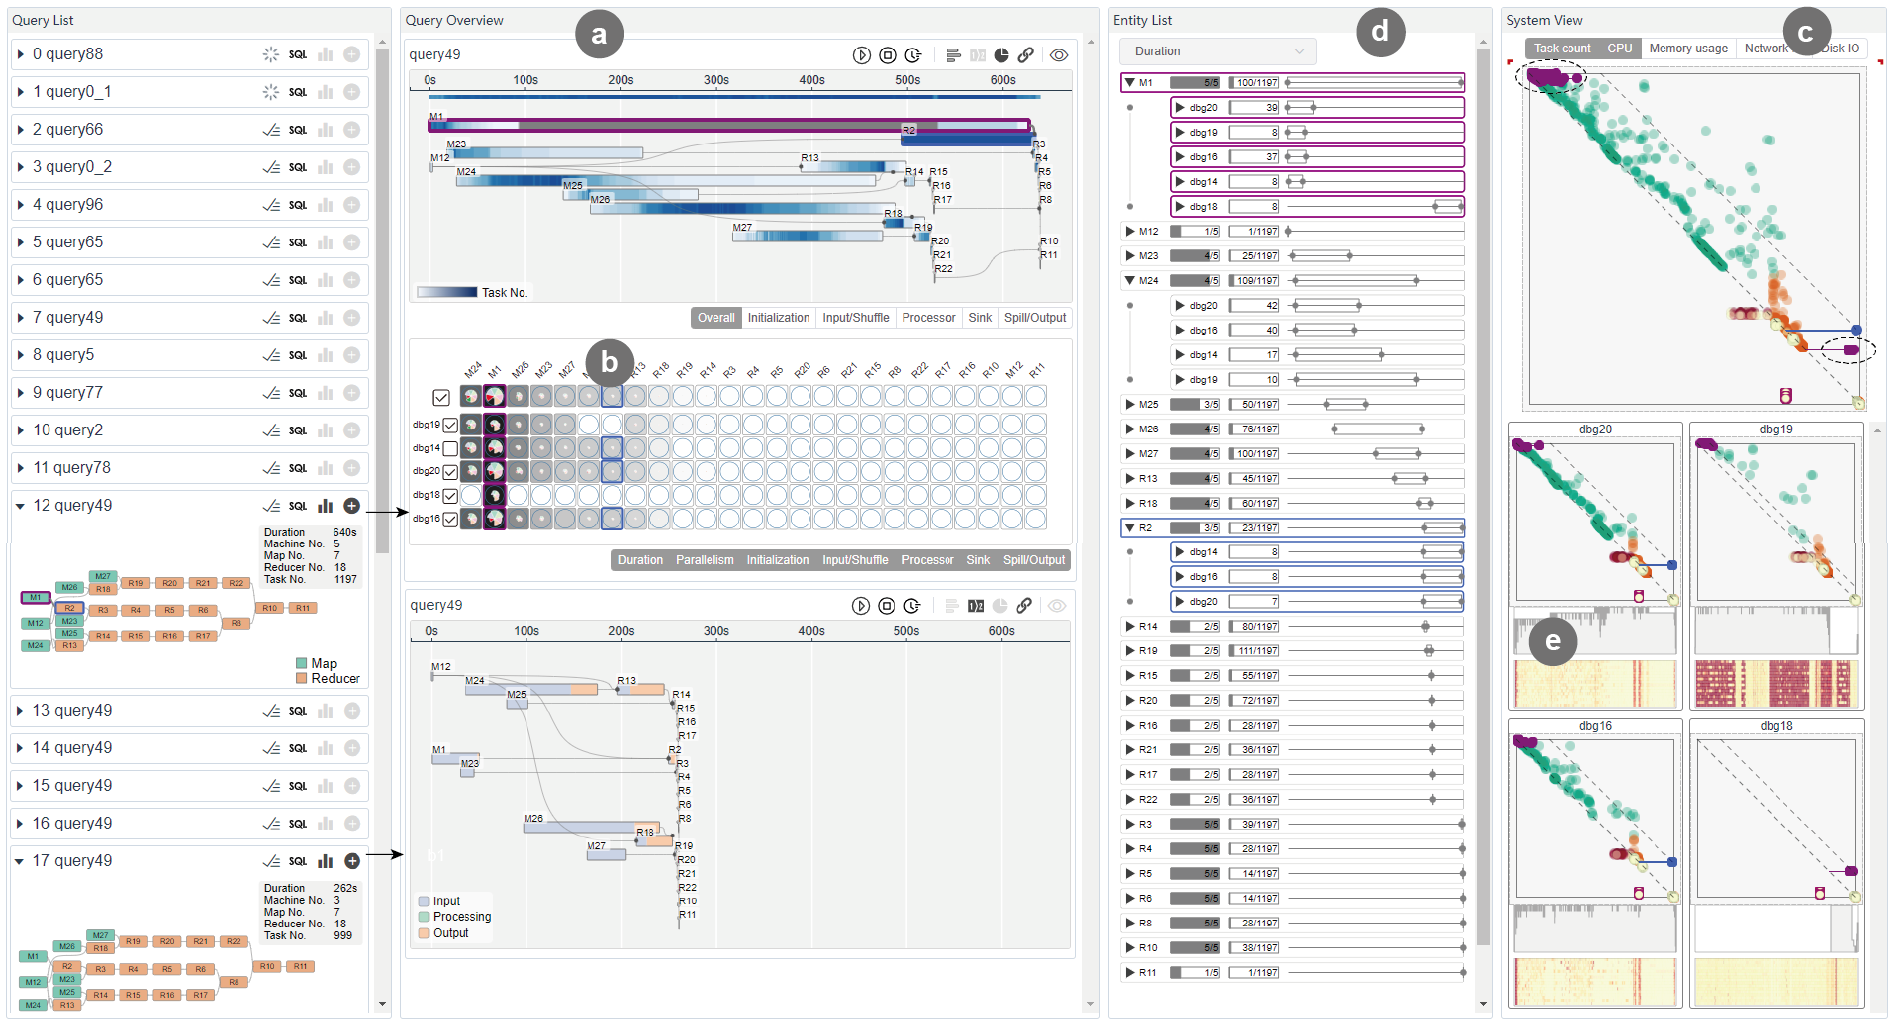
Distributed query processing systems such as Apache Hive and Spark are widely-used in many organizations for large-scale data analytics. Analyzing and understanding the query execution process of these systems are daily routines for engineers and crucial for identifying performance problems, optimizing system configurations, and rectifying errors. However, existing visualization tools for distributed query execution are insufficient because (i) most of them (if not all) do not provide fine-grained visualization (i.e., the atomic task level), which can be crucial for understanding query performance and reasoning about the underlying execution anomalies, and (ii) they do not support proper linkages between system status and query execution, which makes it difficult to identify the causes of execution problems. To tackle these limitations, we propose QEVIS, which visualizes distributed query execution process with multiple views that focus on different granularities and complement each other. Specifically, we first devise a query logical plan layout algorithm to visualize the overall query execution progress compactly and clearly. We then propose two novel scoring methods to summarize the anomaly degrees of the jobs and machines during query execution, and visualize the anomaly scores intuitively, which allow users to easily identify the components that are worth paying attention to. Moreover, we devise a scatter plot-based task view to show a massive number of atomic tasks, where task distribution patterns are informative for execution problems. We also equip QEVIS with a suite of auxiliary views and interaction methods to support easy and effective cross-view exploration, which makes it convenient to track the causes of execution problems. QEVIS has been used in the production environment of our industry partner, and we present three use cases from real-world applications and user interview to demonstrate its effectiveness. QEVIS is open-source at https://github.com/DBGroup-SUSTech/QEVIS.