GeoExplainer: A Visual Analytics Framework for Spatial Modeling Contextualization and Report Generation
Fan Lei, Yuxin Ma, Stewart Fotheringham, Elizabeth Mack, Ziqi Li, Mehak Sachdeva, Sarah Bardin, Ross Maciejewski
DOI: 10.1109/TVCG.2023.3327359
Room: 105
2023-10-26T22:48:00ZGMT-0600Change your timezone on the schedule page
2023-10-26T22:48:00Z
Fast forward
Full Video
Keywords
Spatial data analysis, local models, multiscale geographically weighted regression, model explanation, visual analytics
Abstract
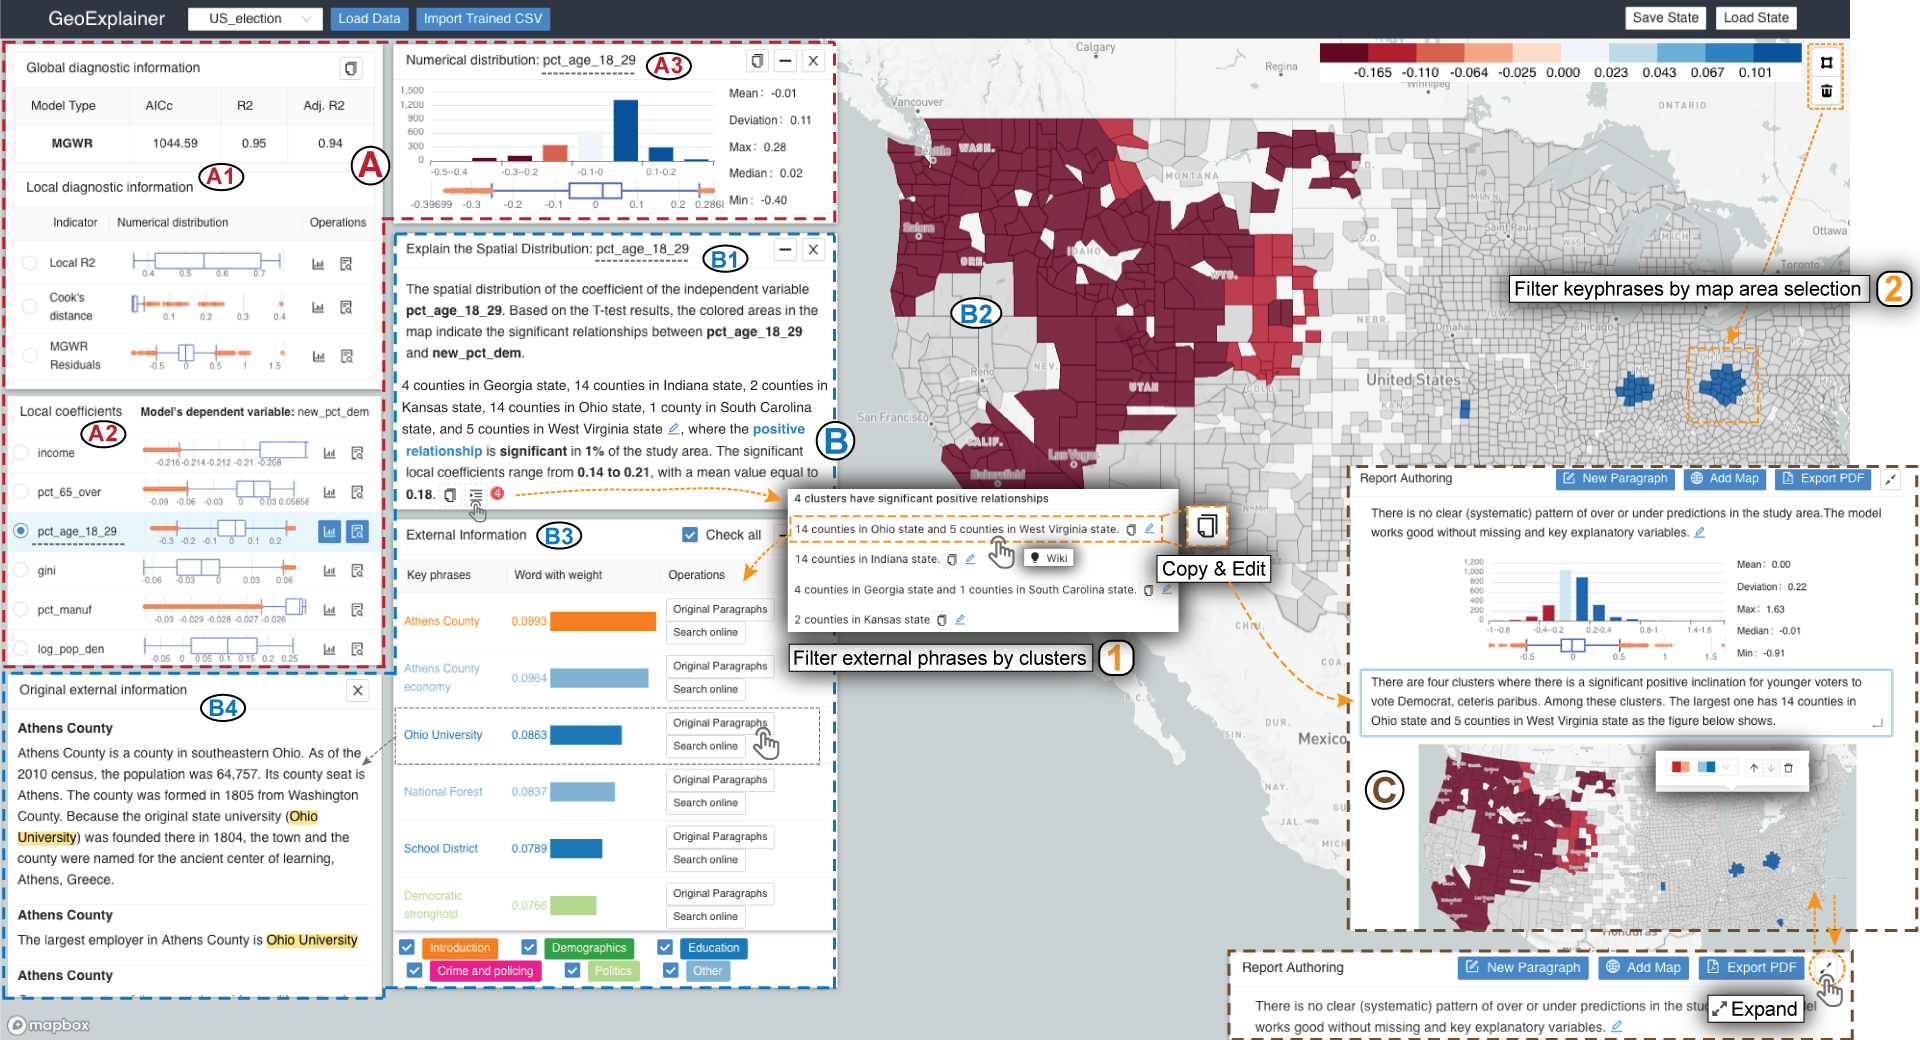
Geographic regression models of various descriptions are often applied to identify patterns and anomalies in the determinants of spatially distributed observations. These types of analyses focus on answering why questions about underlying spatial phenomena, e.g., why is crime higher in this locale, why do children in one school district outperform those in another, etc.? Answers to these questions require explanations of the model structure, the choice of parameters, and contextualization of the findings with respect to their geographic context. This is particularly true for local forms of regression models which are focused on the role of locational context in determining human behavior. In this paper, we present GeoExplainer, a visual analytics framework designed to support analysts in creating explanative documentation that summarizes and contextualizes their spatial analyses. As analysts create their spatial models, our framework flags potential issues with model parameter selections, utilizes template-based text generation to summarize model outputs, and links with external knowledge repositories to provide annotations that help to explain the model results. As analysts explore the model results, all visualizations and annotations can be captured in an interactive report generation widget. We demonstrate our framework using a case study modeling the determinants of voting in the 2016 US Presidential Election.