Reclaiming the Horizon: Novel Visualization Designs for Time-Series Data with Large Value Ranges
Daniel Braun, Rita Borgo, Max Sondag, Tatiana von Landesberger
DOI: 10.1109/TVCG.2023.3326576
Room: 104
2023-10-26T05:09:00ZGMT-0600Change your timezone on the schedule page
2023-10-26T05:09:00Z
Fast forward
Full Video
Keywords
Visualization techniques, time-series, design study, orders of magnitude, logarithmic scale
Abstract
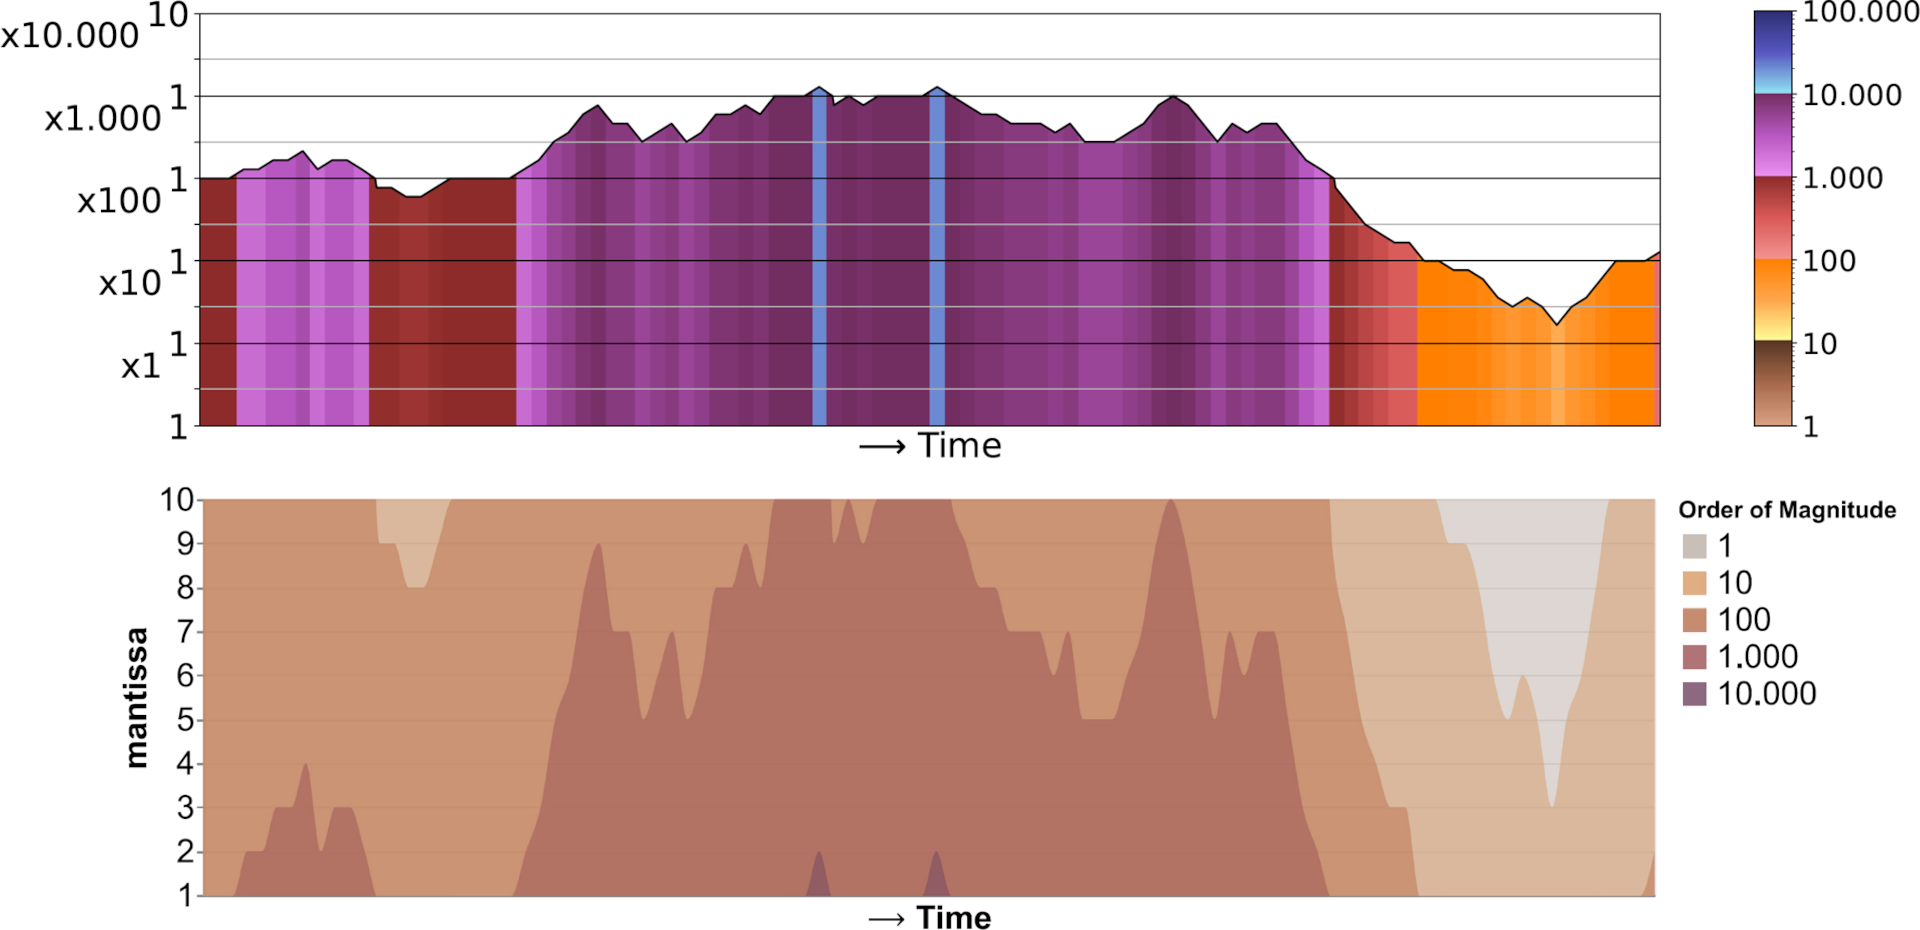
We introduce two novel visualization designs to support practitioners in performing identification and discrimination tasks on large value ranges (i.e., several orders of magnitude) in time-series data: (1) The order of magnitude horizon graph, which extends the classic horizon graph; and (2) the order of magnitude line chart, which adapts the log-line chart. These new visualization designs visualize large value ranges by explicitly splitting the mantissa 𝑚 and exponent 𝑒 of a value 𝑣 = 𝑚 · 10𝑒. We evaluate our novel designs against the most relevant state-of-the-art visualizations in an empirical user study. It focuses on four main tasks commonly employed in the analysis of time-series and large value ranges visualization: identification, discrimination, estimation, and trend detection. For each task we analyze error, confidence, and response time. The new order of magnitude horizon graph performs better or equal to all other designs in identification, discrimination, and estimation tasks. Only for trend detection tasks, the more traditional horizon graphs reported better performance. Our results are domain-independent, only requiring time-series data with large value ranges.