Honorable Mention
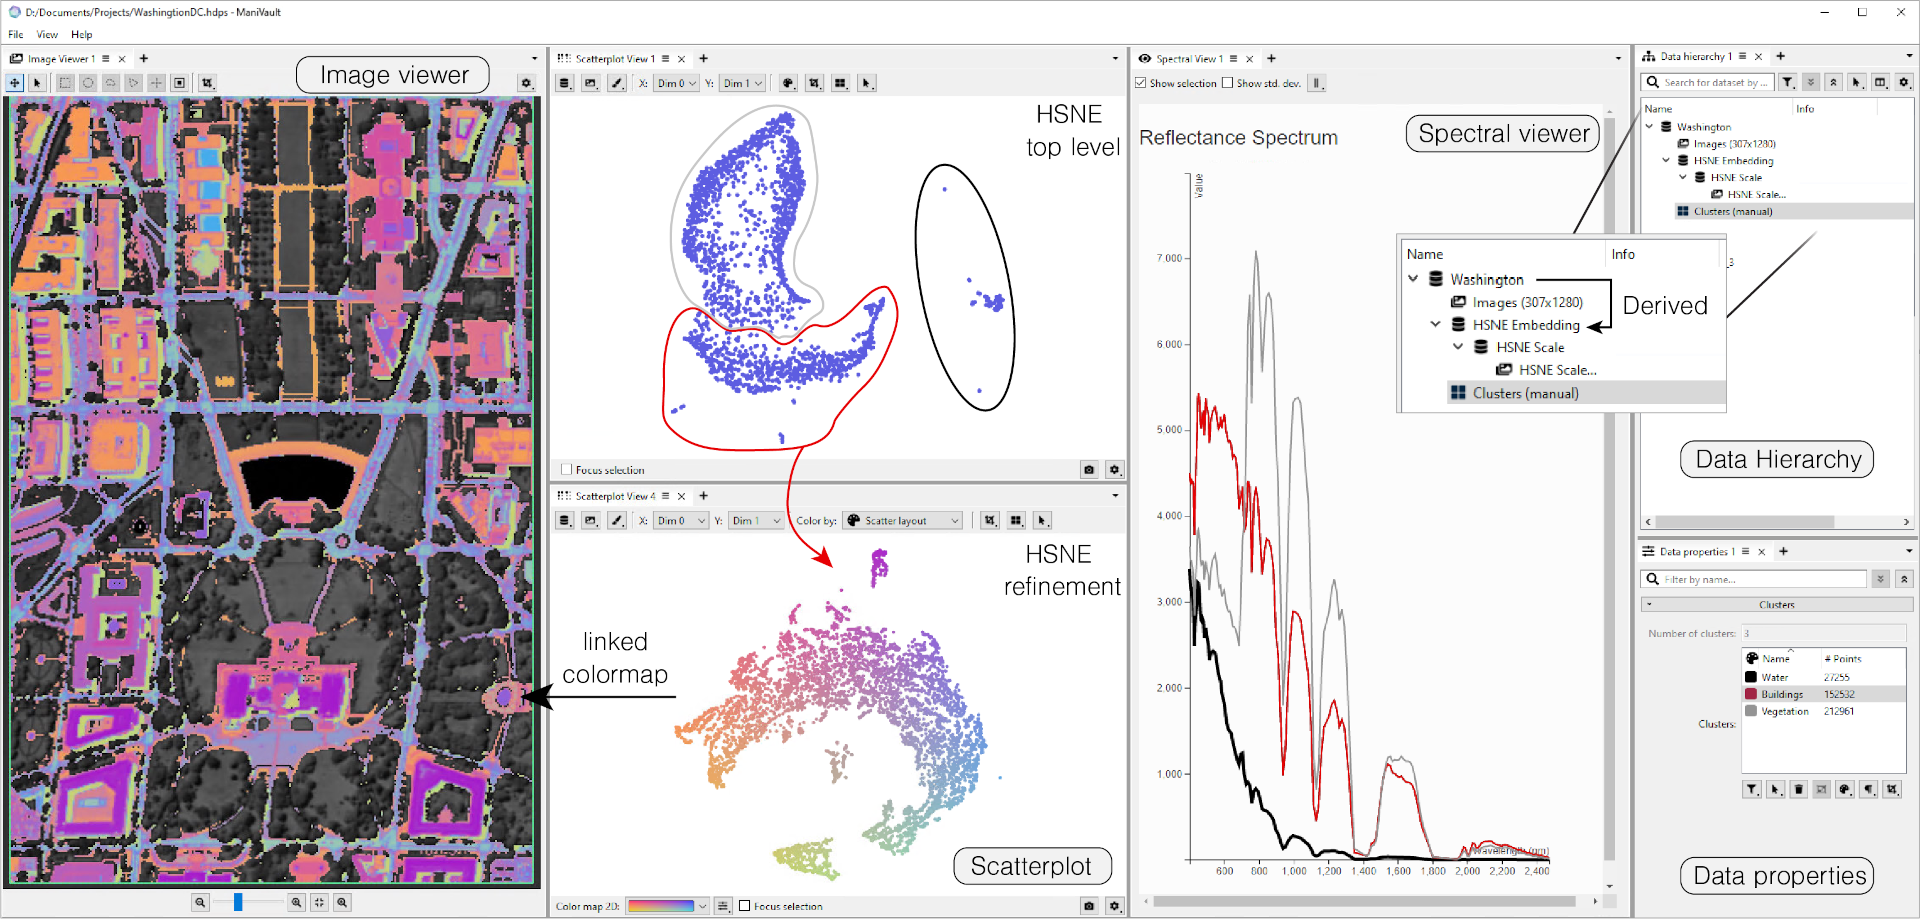
ManiVault: A Flexible and Extensible Visual Analytics Framework for High-Dimensional Data
Alexander Vieth, Thomas Kroes, Julian Thijssen, Baldur van Lew, Jeroen Eggermont, Soumyadeep Basu, Elmar Eisemann, Anna Vilanova, Thomas Höllt, Boudewijn Lelieveldt
DOI: 10.1109/TVCG.2023.3326582
Room: 106
2023-10-24T23:00:00ZGMT-0600Change your timezone on the schedule page
2023-10-24T23:00:00Z
Fast forward
Full Video
Keywords
High-dimensional data, Visual analytics, Visualization framework, Progressive analytics, Prototyping system
Abstract
Exploration and analysis of high-dimensional data are important tasks in many fields that produce large and complex data, like the financial sector, systems biology, or cultural heritage. Tailor-made visual analytics software is developed for each specific application, limiting their applicability in other fields. However, as diverse as these fields are, their characteristics and requirements for data analysis are conceptually similar. Many applications share abstract tasks and data types and are often constructed with similar building blocks. Developing such applications, even when based mostly on existing building blocks, requires significant engineering efforts. We developed ManiVault, a flexible and extensible open-source visual analytics framework for analyzing high-dimensional data. The primary objective of ManiVault is to facilitate rapid prototyping of visual analytics workflows for visualization software developers and practitioners alike. ManiVault is built using a plugin-based architecture that offers easy extensibility. While our architecture deliberately keeps plugins self-contained, to guarantee maximum flexibility and re-usability, we have designed and implemented a messaging API for tight integration and linking of modules to support common visual analytics design patterns. We provide several visualization and analytics plugins, and ManiVault's API makes the integration of new plugins easy for developers. ManiVault facilitates the distribution of visualization and analysis pipelines and results for practitioners through saving and reproducing complete application states. As such, ManiVault can be used as a communication tool among researchers to discuss workflows and results. A copy of this paper and all supplemental material is available at https://osf.io/9k6jw and source code at https://github.com/ManiVaultStudio.