Guaranteed Visibility in Scatterplots with Tolerance
Loann Giovannangeli, Frédéric Lalanne, Romain Giot, Romain Bourqui
DOI: 10.1109/TVCG.2023.3326596
Room: 104
2023-10-25T23:00:00ZGMT-0600Change your timezone on the schedule page
2023-10-25T23:00:00Z
Fast forward
Full Video
Keywords
Guaranteed visibility, Layout adjustment, Overlap removal, Scatterplots
Abstract
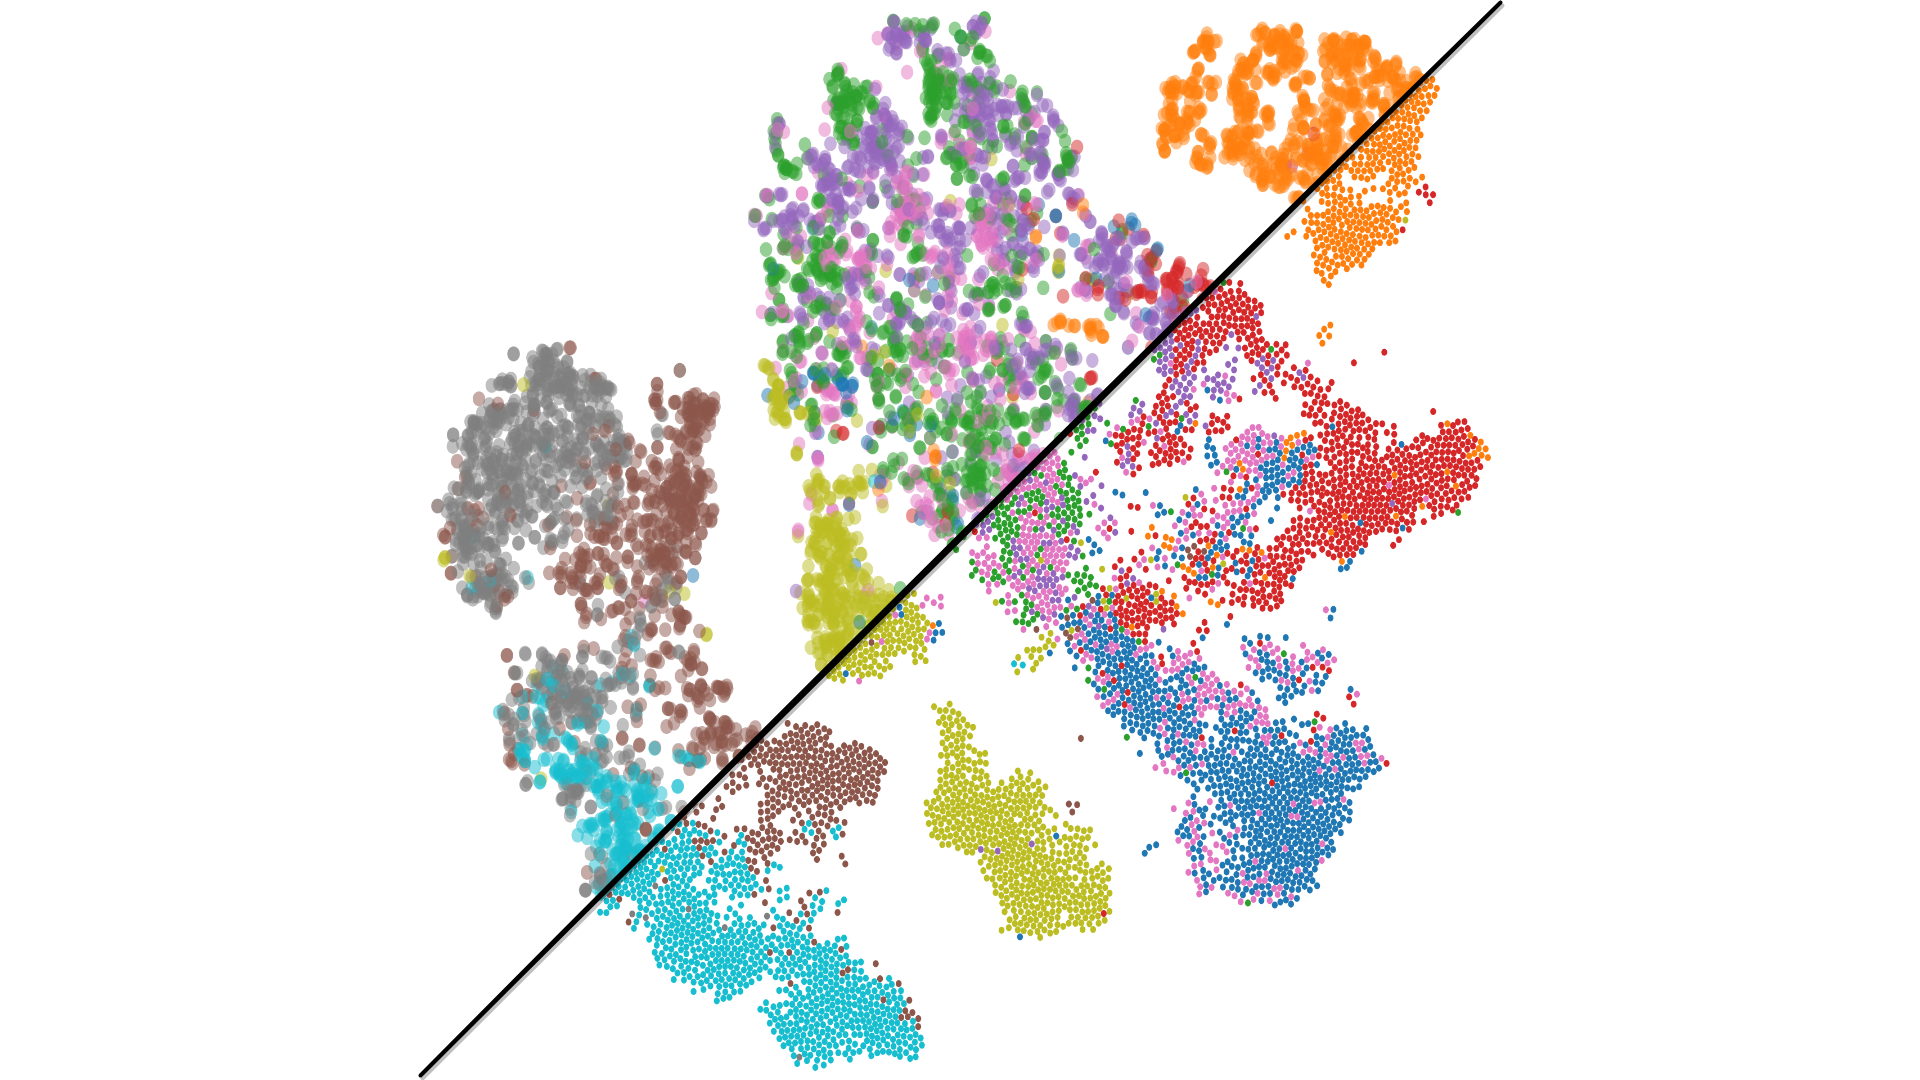
In 2D visualizations, visibility of every datum's representation is crucial to ease the completion of visual tasks. Such a guarantee is barely respected in complex visualizations, mainly because of overdraws between datum representations that hide parts of the information (e.g., outliers). The literature proposes various Layout Adjustment algorithms to improve the readability of visualizations that suffer from this issue. Manipulating the data in high-dimensional, geometric or visual space; they rely on different strategies with their own strengths and weaknesses. Moreover, most of these algorithms are computationally expensive as they search for an exact solution in the geometric space and do not scale well to large datasets. This article proposes GIST, a layout adjustment algorithm that aims at optimizing three criteria: (i) node visibility guarantee (at least 1 pixel), (ii) node size maximization, and (iii) the original layout preservation. This is achieved by combining a search for the maximum node size that enables to draw all the data points without overlaps, with a limited budget of movements (i.e., limiting the distortions of the original layout). The method's basis relies on the idea that it is not necessary for two data representations to be strictly not overlapping in order to guarantee their visibility in visual space. Our algorithm therefore uses a tolerance in the geometric space to determine the overlaps between pairs of data. The tolerance is optimized such that the approximation computed in the geometric space can lead to visualization without noticeable overdraw after the data rendering rasterization. In addition, such an approximation helps to ease the algorithm's convergence as it reduces the number of constraints to resolve, enabling it to handle large datasets. We demonstrate the effectiveness of our approach by comparing its results to those of state-of-the-art methods on several large datasets.