Causality-Based Visual Analysis of Questionnaire Responses
Renzhong Li, Weiwei Cui, Tianqi Song, Xiao Xie, Rui Ding, Yun Wang, Haidong Zhang, Hong Zhou, Yingcai Wu
DOI: 10.1109/TVCG.2023.3327376
Room: 106
2023-10-25T05:33:00ZGMT-0600Change your timezone on the schedule page
2023-10-25T05:33:00Z
Fast forward
Full Video
Keywords
Causal analysis, Questionnaire, Design study
Abstract
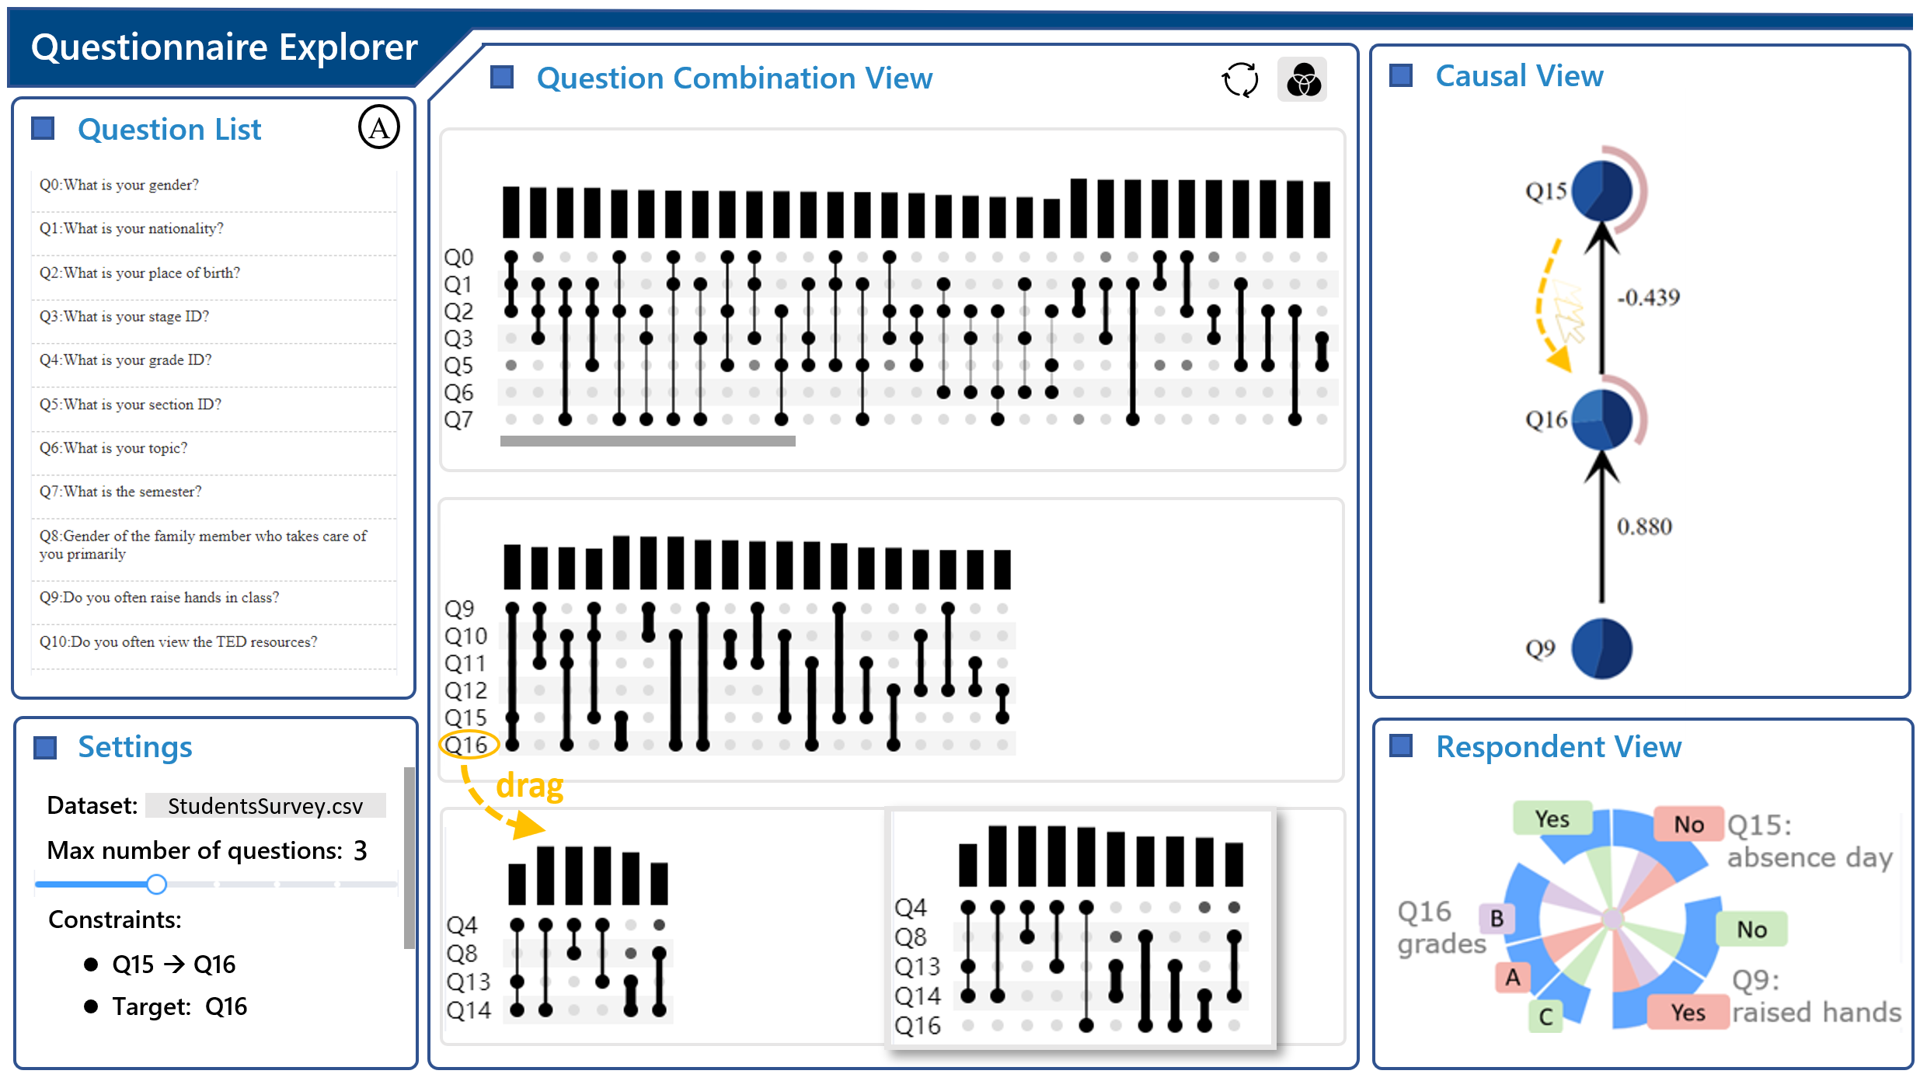
As the final stage of questionnaire analysis, causal reasoning is the key to turning responses into valuable insights and actionable items for decision-makers. During the questionnaire analysis, classical statistical methods (e.g., Differences-in-Differences) have been widely exploited to evaluate causality between questions. However, due to the huge search space and complex causal structure in data, causal reasoning is still extremely challenging and time-consuming, and often conducted in a trial-and-error manner. On the other hand, existing visual methods of causal reasoning face the challenge of bringing scalability and expert knowledge together and can hardly be used in the questionnaire scenario. In this work, we present a systematic solution to help analysts effectively and efficiently explore questionnaire data and derive causality. Based on the association mining algorithm, we dig question combinations with potential inner causality and help analysts interactively explore the causal sub-graph of each question combination. Furthermore, leveraging the requirements collected from the experts, we built a visualization tool and conducted a comparative study with the state-of-the-art system to show the usability and efficiency of our system.