MolSieve: A Progressive Visual Analytics System for Molecular Dynamics Simulations
Rostyslav Hnatyshyn, Jieqiong Zhao, Danny Perez, James Ahrens, Ross Maciejewski
DOI: 10.1109/TVCG.2023.3326584
Room: 103
2023-10-25T22:24:00ZGMT-0600Change your timezone on the schedule page
2023-10-25T22:24:00Z
Fast forward
Full Video
Keywords
Molecular dynamics, time-series analysis, visual analytics
Abstract
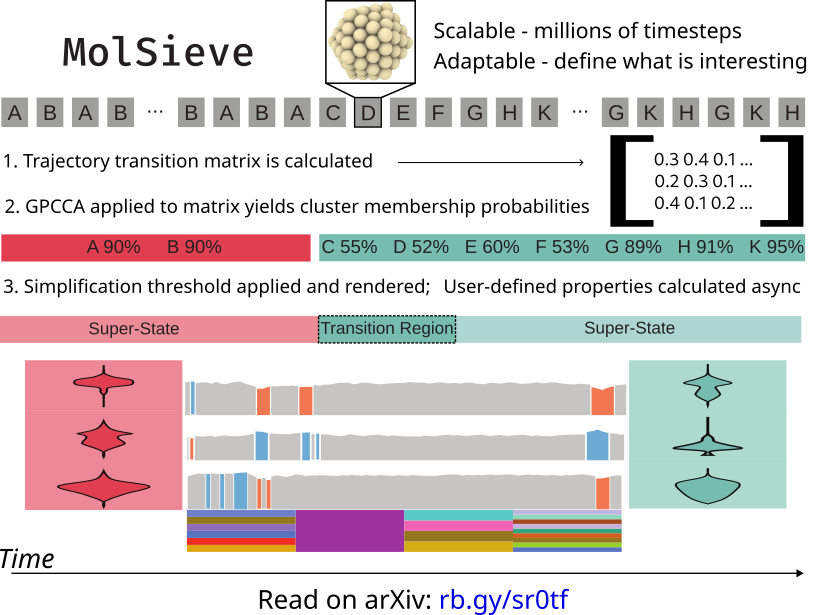
Molecular Dynamics (MD) simulations are ubiquitous in cutting-edge physio-chemical research. They provide critical insights into how a physical system evolves over time given a model of interatomic interactions. Understanding a system’s evolution is key to selecting the best candidates for new drugs, materials for manufacturing, and countless other practical applications. With today’s technology, these simulations can encompass millions of unit transitions between discrete molecular structures, spanning up to several milliseconds of real time. Attempting to perform a brute-force analysis with data-sets of this size is not only computationally impractical, but would not shed light on the physically-relevant features of the data. Moreover, there is a need to analyze simulation ensembles in order to compare similar processes in differing environments. These problems call for an approach that is analytically transparent, computationally efficient, and flexible enough to handle the variety found in materials-based research. In order to address these problems, we introduce MolSieve, a progressive visual analytics system that enables the comparison of multiple long-duration simulations. Using MolSieve, analysts are able to quickly identify and compare regions of interest within immense simulations through its combination of control charts, data-reduction techniques, and highly informative visual components. A simple programming interface is provided which allows experts to fit MolSieve to their needs. To demonstrate the efficacy of our approach, we present two case studies of MolSieve and report on findings from domain collaborators.