A Comparative Study of the Perceptual Sensitivity of Topological Visualizations to Feature Variations
Tushar M. Athawale, Bryan Triana, Tanmay Kotha, David Pugmire, Paul Rosen
DOI: 10.1109/TVCG.2023.3326592
Room: 106
2023-10-26T03:36:00ZGMT-0600Change your timezone on the schedule page
2023-10-26T03:36:00Z

Fast forward
Full Video
Keywords
Perception & cognition, computational topology-based techniques, comparison and similarity.
Abstract
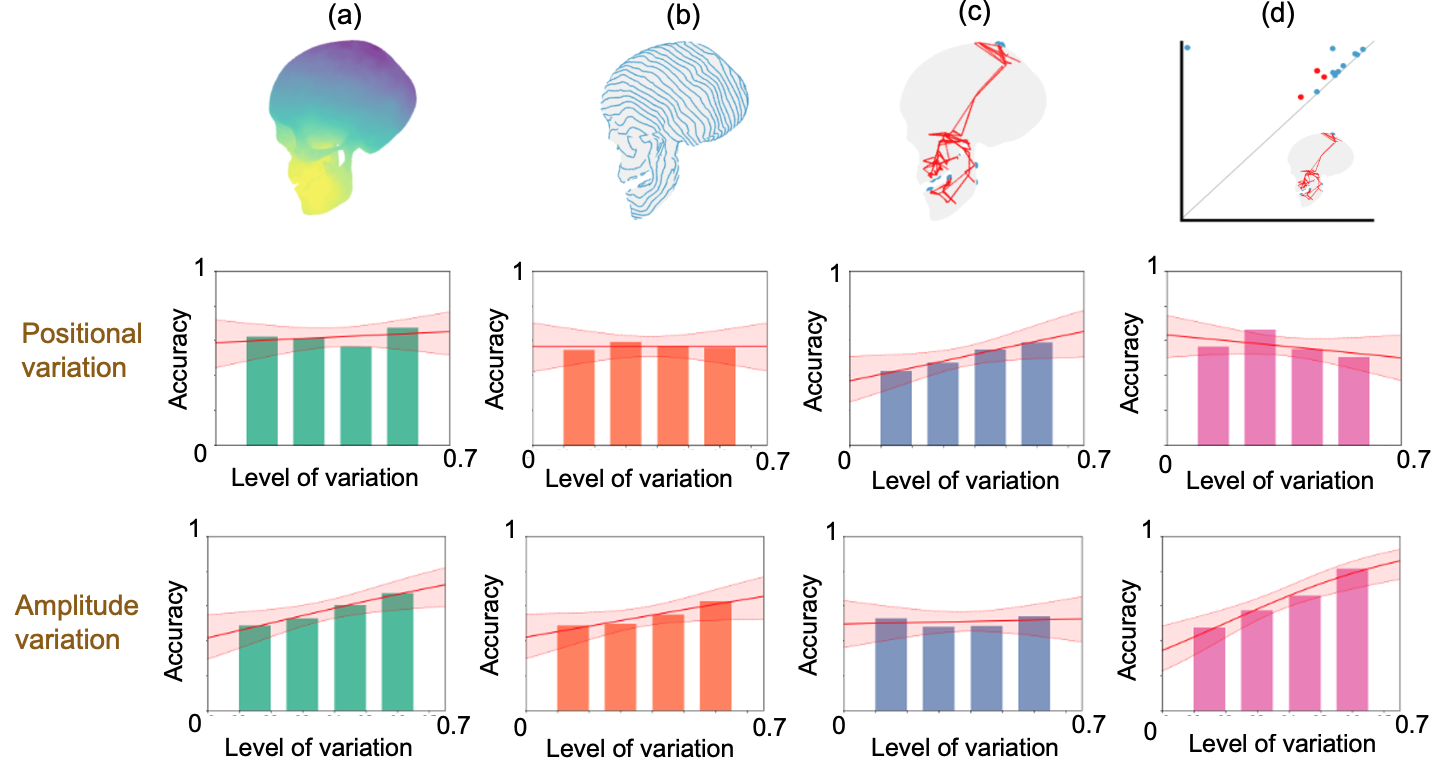
Color maps are a commonly used visualization technique in which data are mapped to optical properties, e.g., color or opacity. Color maps, however, do not explicitly convey structures (e.g., positions and scale of features) within data. Topology-based visualizations reveal and explicitly communicate structures underlying data. Although our understanding of what types of features are captured by topological visualizations is good, our understanding of people's perception of those features is not. This paper evaluates the sensitivity of topology-based isocontour, Reeb graph, and persistence diagram visualizations compared to a reference color map visualization for synthetically generated scalar fields on 2-manifold triangular meshes embedded in 3D. In particular, we built and ran a human-subject study that evaluated the perception of data features characterized by Gaussian signals and measured how effectively each visualization technique portrays variations of data features arising from the position and amplitude variation of a mixture of Gaussians. For positional feature variations, the results showed that only the Reeb graph visualization had high sensitivity. For amplitude feature variations, persistence diagrams and color maps demonstrated the highest sensitivity, whereas isocontours showed only weak sensitivity. These results take an important step toward understanding which topology-based tools are best for various data and task scenarios and their effectiveness in conveying topological variations as compared to conventional color mapping.