Honorable Mention
Data Formulator: AI-powered Concept-driven Visualization Authoring
Chenglong Wang, John R Thompson, Bongshin Lee
DOI: 10.1109/TVCG.2023.3326585
Room: 109
2023-10-26T03:48:00ZGMT-0600Change your timezone on the schedule page
2023-10-26T03:48:00Z
Fast forward
Full Video
Keywords
AI, visualization authoring, data transformation, programming by example, natural language, large language model
Abstract
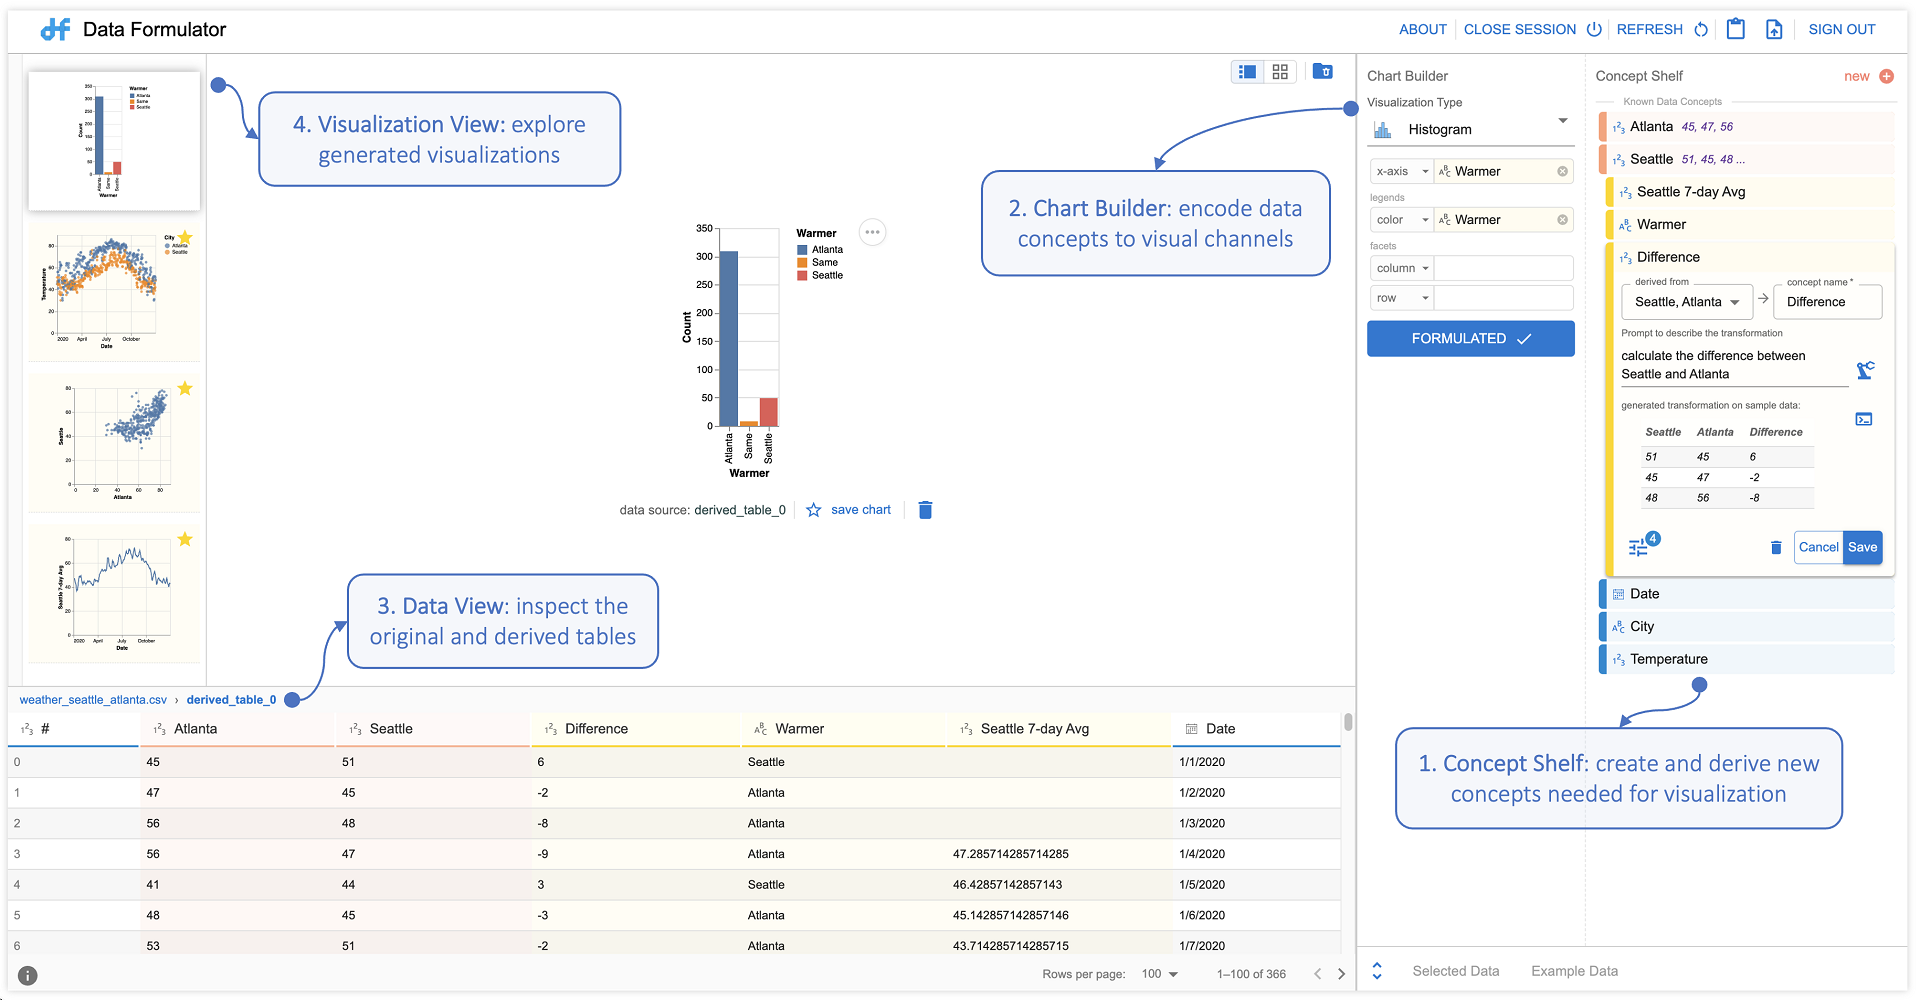
With most modern visualization tools, authors need to transform their data into tidy formats to create visualizations they want. Because this requires experience with programming or separate data processing tools, data transformation remains a barrier in visualization authoring. To address this challenge, we present a new visualization paradigm, concept binding, that separates high-level visualization intents and low-level data transformation steps, leveraging an AI agent. We realize this paradigm in Data Formulator, an interactive visualization authoring tool. With Data Formulator, authors first define data concepts they plan to visualize using natural languages or examples, and then bind them to visual channels. Data Formulator then dispatches its AI-agent to automatically transform the input data to surface these concepts and generate desired visualizations. When presenting the results (transformed table and output visualizations) from the AI-agent, Data Formulator provides feedback to help authors inspect and understand them. A user study with 10 participants shows that participants could learn and use Data Formulator to create visualizations that involve challenging data transformations, and presents interesting future research directions.