Designing for Ambiguity in Visual Analytics: Lessons from Risk Assessment and Prediction
Stan Nowak, Lyn Bartram
DOI: 10.1109/TVCG.2023.3326571
Room: 105
2023-10-26T00:09:00ZGMT-0600Change your timezone on the schedule page
2023-10-26T00:09:00Z
Fast forward
Full Video
Keywords
Complex Systems, Risk Assessment, Sensemaking, Visualization Design
Abstract
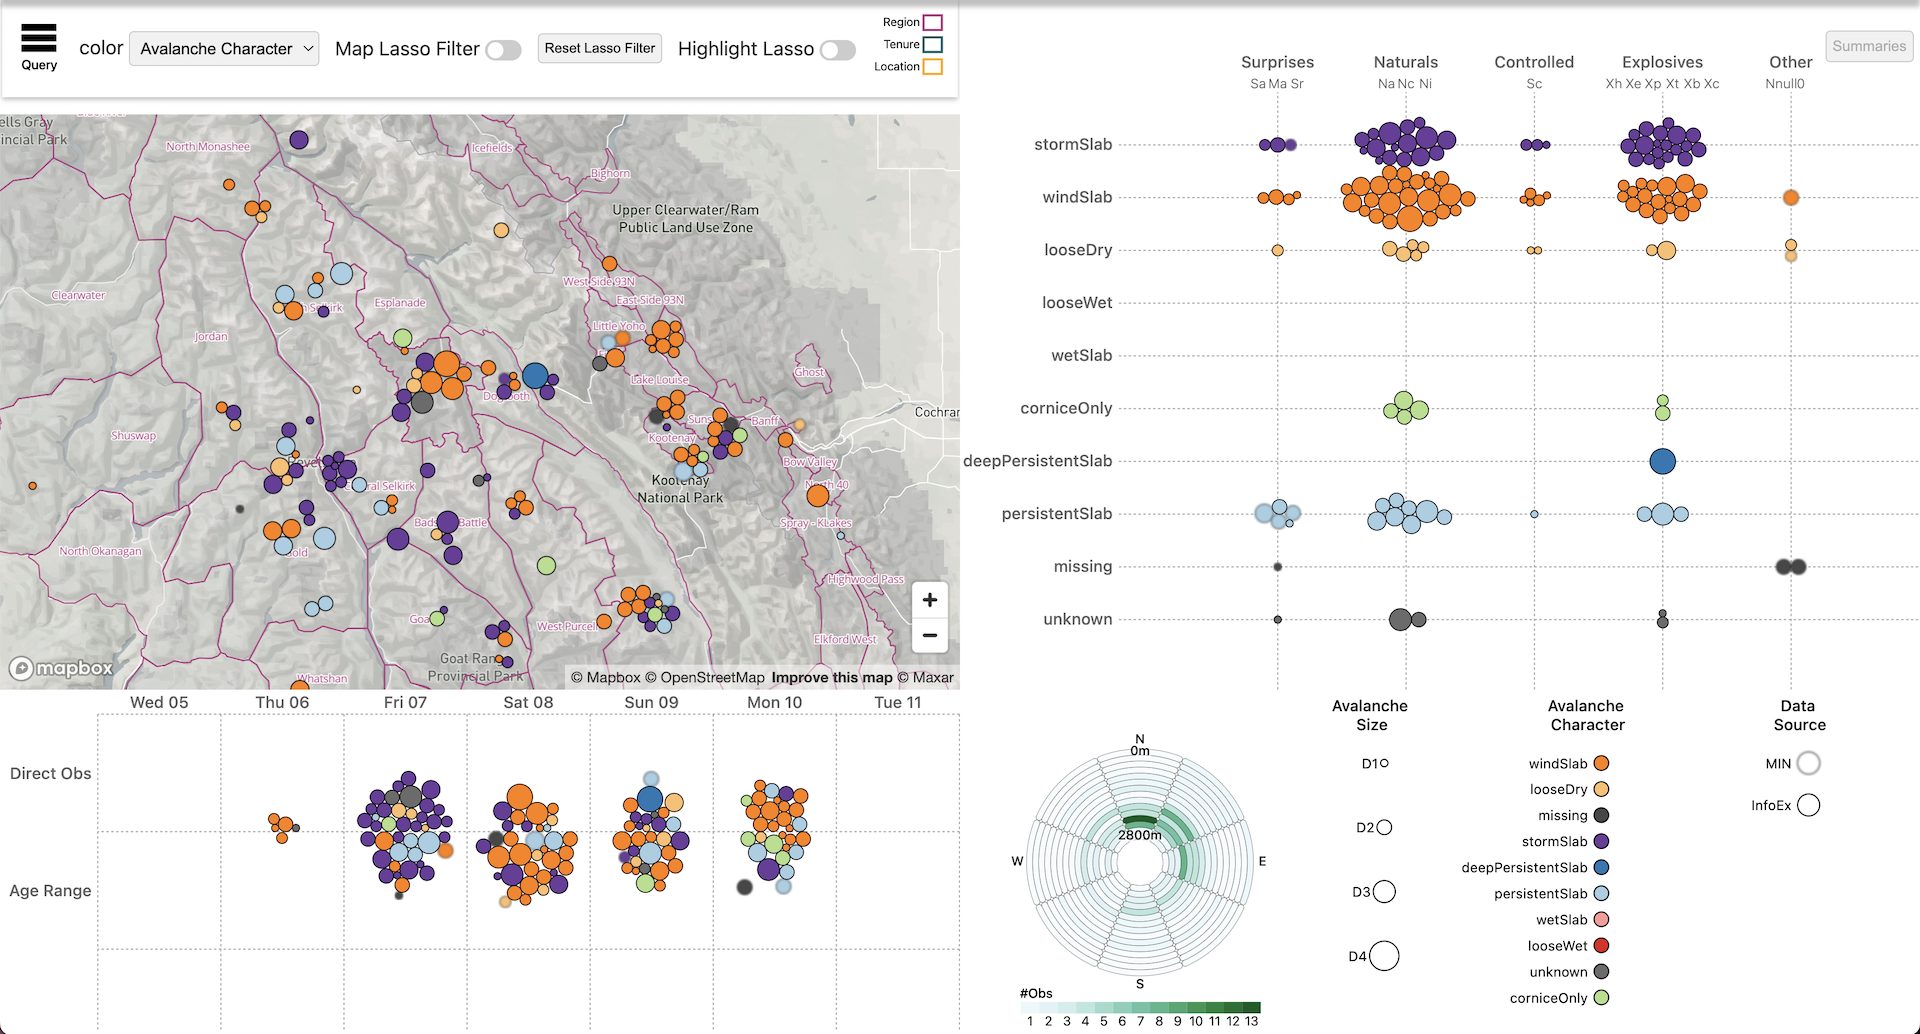
Ambiguity is pervasive in the complex sensemaking domains of risk assessment and prediction but there remains little research on how to design visual analytics tools to accommodate it. We report on findings from a qualitative study based on a conceptual framework of sensemaking processes to investigate how both new visual analytics designs and existing tools, primarily data tables, support the cognitive work demanded in avalanche forecasting. While both systems yielded similar analytic outcomes we observed differences in ambiguous sensemaking and the analytic actions either afforded. Our findings challenge conventional visualization design guidance in both perceptual and interaction design, highlighting the need for data interfaces that encourage reflection, provoke alternative interpretations, and support the inherently ambiguous nature of sensemaking in this critical application. We review how different visual and interactive forms support or impede analytic processes and introduce "gisting" as a significant yet unexplored analytic action for visual analytics research. We conclude with design implications for enabling ambiguity in visual analytics tools to scaffold sensemaking in risk assessment.