VISPUR: Visual Aids for Identifying and Interpreting Spurious Associations in Data-Driven Decisions
Xian Teng, Yongsu Ahn, Yu-Ru Lin
DOI: 10.1109/TVCG.2023.3326587
Room: 109
2023-10-24T22:48:00ZGMT-0600Change your timezone on the schedule page
2023-10-24T22:48:00Z
Fast forward
Full Video
Keywords
Causal Analysis, Simpson’s Paradox, Spurious Associations, Machine Learning, Decision Making
Abstract
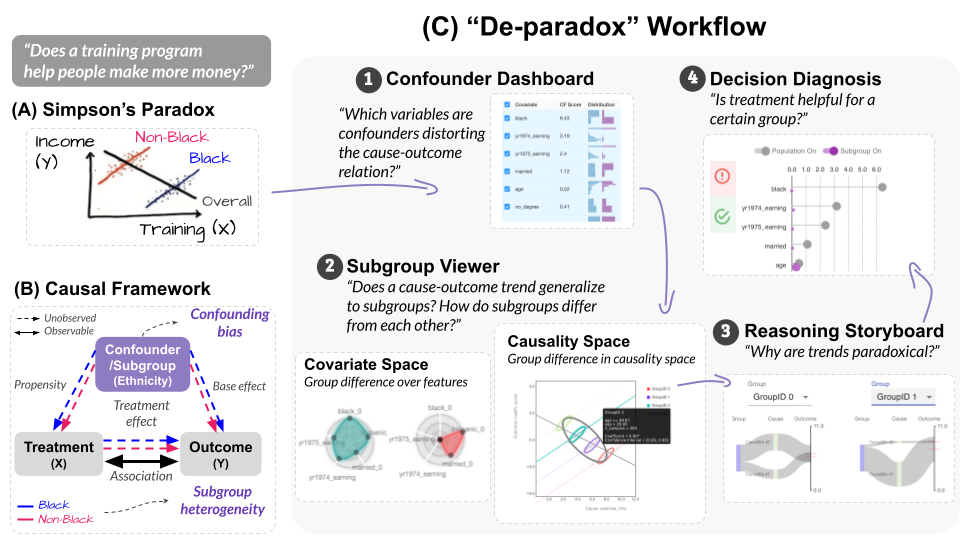
Big data and machine learning tools have jointly empowered humans in making data-driven decisions. However, many of them capture empirical associations that might be spurious due to confounding factors and subgroup heterogeneity. The famous Simpson’s paradox is such a phenomenon where aggregated and subgroup-level associations contradict with each other, causing cognitive confusions and difficulty in making adequate interpretations and decisions. Existing tools provide little insights for humans to locate, reason about, and prevent pitfalls of spurious association in practice. We propose VISPUR, a visual analytic system that provides a causal analysis framework and a human-centric workflow for tackling spurious associations. These include a CONFOUNDER DASHBOARD, which can automatically identify possible confounding factors, and a SUBGROUP VIEWER, which allows for the visualization and comparison of diverse subgroup patterns that likely or potentially result in a misinterpretation of causality. Additionally, we propose a REASONING STORYBOARD, which uses a flow-based approach to illustrate paradoxical phenomena, as well as an interactive DECISION DIAGNOSIS panel that helps ensure accountable decision-making. Through an expert interview and a controlled user experiment, our qualitative and quantitative results demonstrate that the proposed “de-paradox” workflow and the designed visual analytic system are effective in helping human users to identify and understand spurious associations, as well as to make accountable causal decisions.