EVM: Incorporating Model Checking into Exploratory Visual Analysis
Alex Kale, Ziyang Guo, xiaoli Qiao, Jeffrey Heer, Jessica Hullman
DOI: 10.1109/TVCG.2023.3326516
Room: 109
2023-10-24T22:36:00ZGMT-0600Change your timezone on the schedule page
2023-10-24T22:36:00Z
Fast forward
Full Video
Keywords
Visualization, model checks, exploratory analysis
Abstract
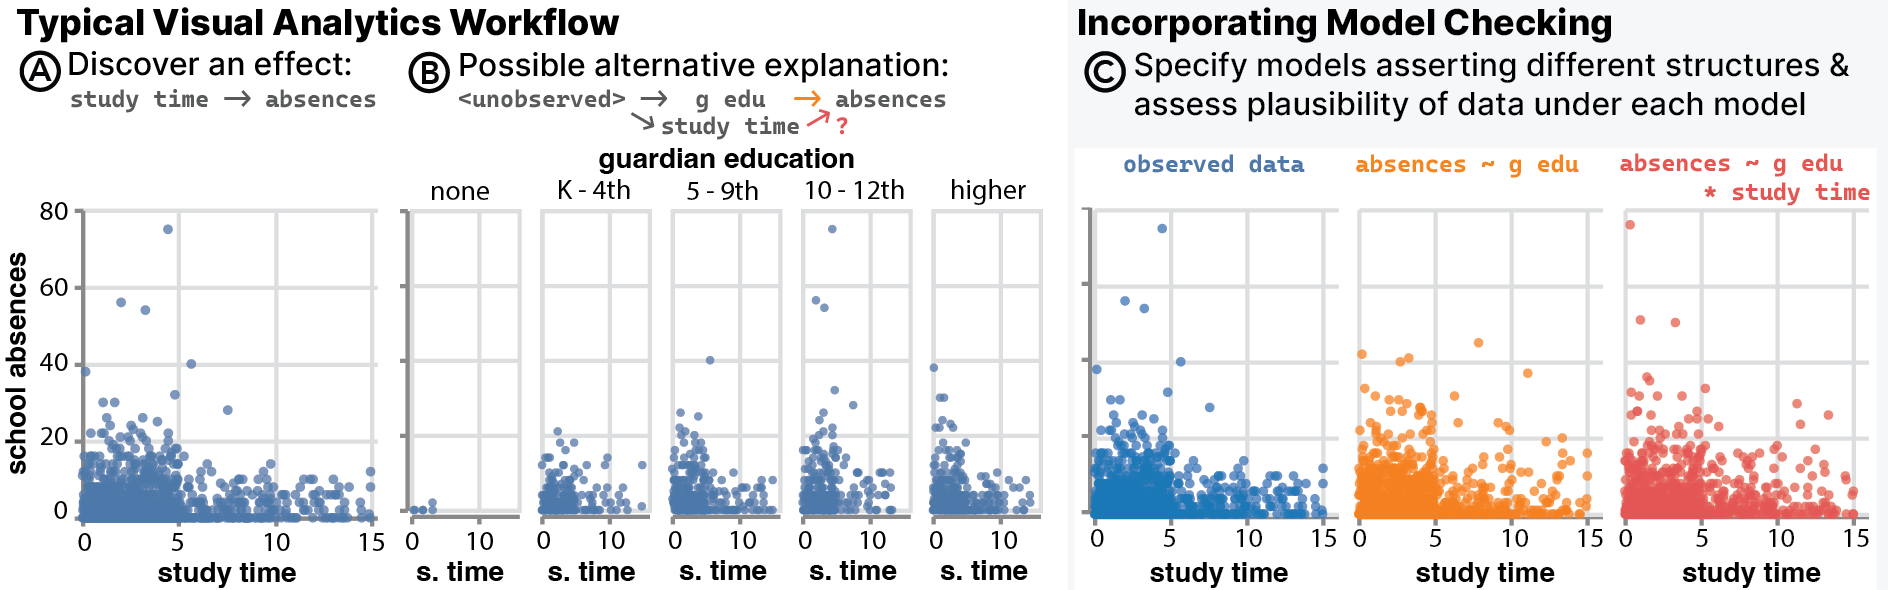
Visual analytics (VA) tools support data exploration by helping analysts quickly and iteratively generate views of data which reveal interesting patterns. However, these tools seldom enable explicit checks of the resulting interpretations of data—e.g., whether patterns can be accounted for by a model that implies a particular structure in the relationships between variables. We present EVM, a data exploration tool that enables users to express and check provisional interpretations of data in the form of statistical models. EVM integrates support for visualization-based model checks by rendering distributions of model predictions alongside user-generated views of data. In a user study with data scientists practicing in the private and public sector, we evaluate how model checks influence analysts’ thinking during data exploration. Our analysis characterizes how participants use model checks to scrutinize expectations about data generating process and surfaces further opportunities to scaffold model exploration in VA tools.