Compact Phase Histograms for Guided Exploration of Periodicity
Max Franke, Steffen Koch
Room: 104
2023-10-26T03:36:00ZGMT-0600Change your timezone on the schedule page
2023-10-26T03:36:00Z
Fast forward
Full Video
Keywords
Human-centered computing—Visualization—Visualization techniques
Abstract
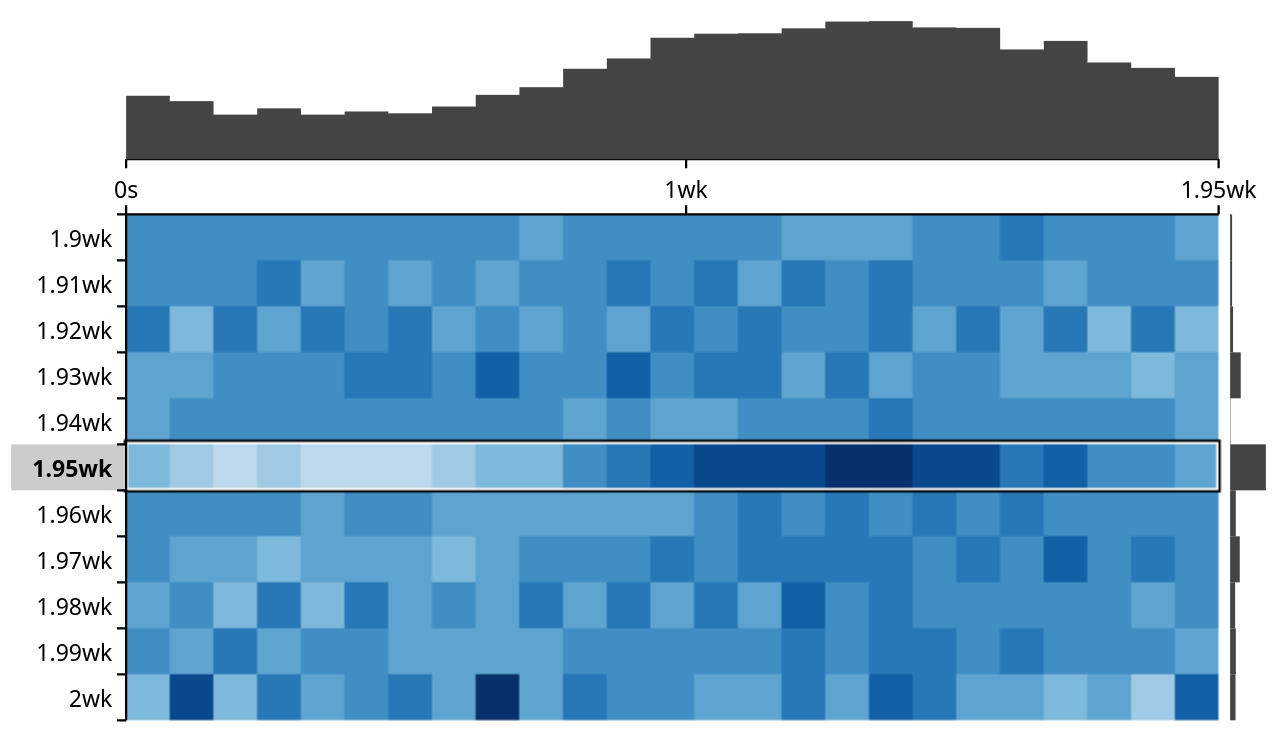
Periodically occurring accumulations of events or measured values are present in many time-dependent datasets and can be of interest for analyses. The frequency of such periodic behavior is often not known in advance, making it difficult to detect and tedious to explore. Automated analysis methods exist, but can be too costly for smooth, interactive analysis. We propose a compact visual representation that reveals periodicity by showing a phase histogram for a given period length that can be used standalone or in combination with other linked visualizations. Our approach supports guided, interactive analyses by suggesting other period lengths to explore, which are ranked based on two quality measures. We further describe how the phase can be mapped to visual representations in other views to reveal periodicity there.