Visualizing Query Traversals Over Bounding Volume Hierarchies Using Treemaps
Abhishek Madan, Carolina Nobre
Room: 104
2023-10-25T03:00:00ZGMT-0600Change your timezone on the schedule page
2023-10-25T03:00:00Z
Fast forward
Full Video
Keywords
bounding volume hierarchies, treemaps
Abstract
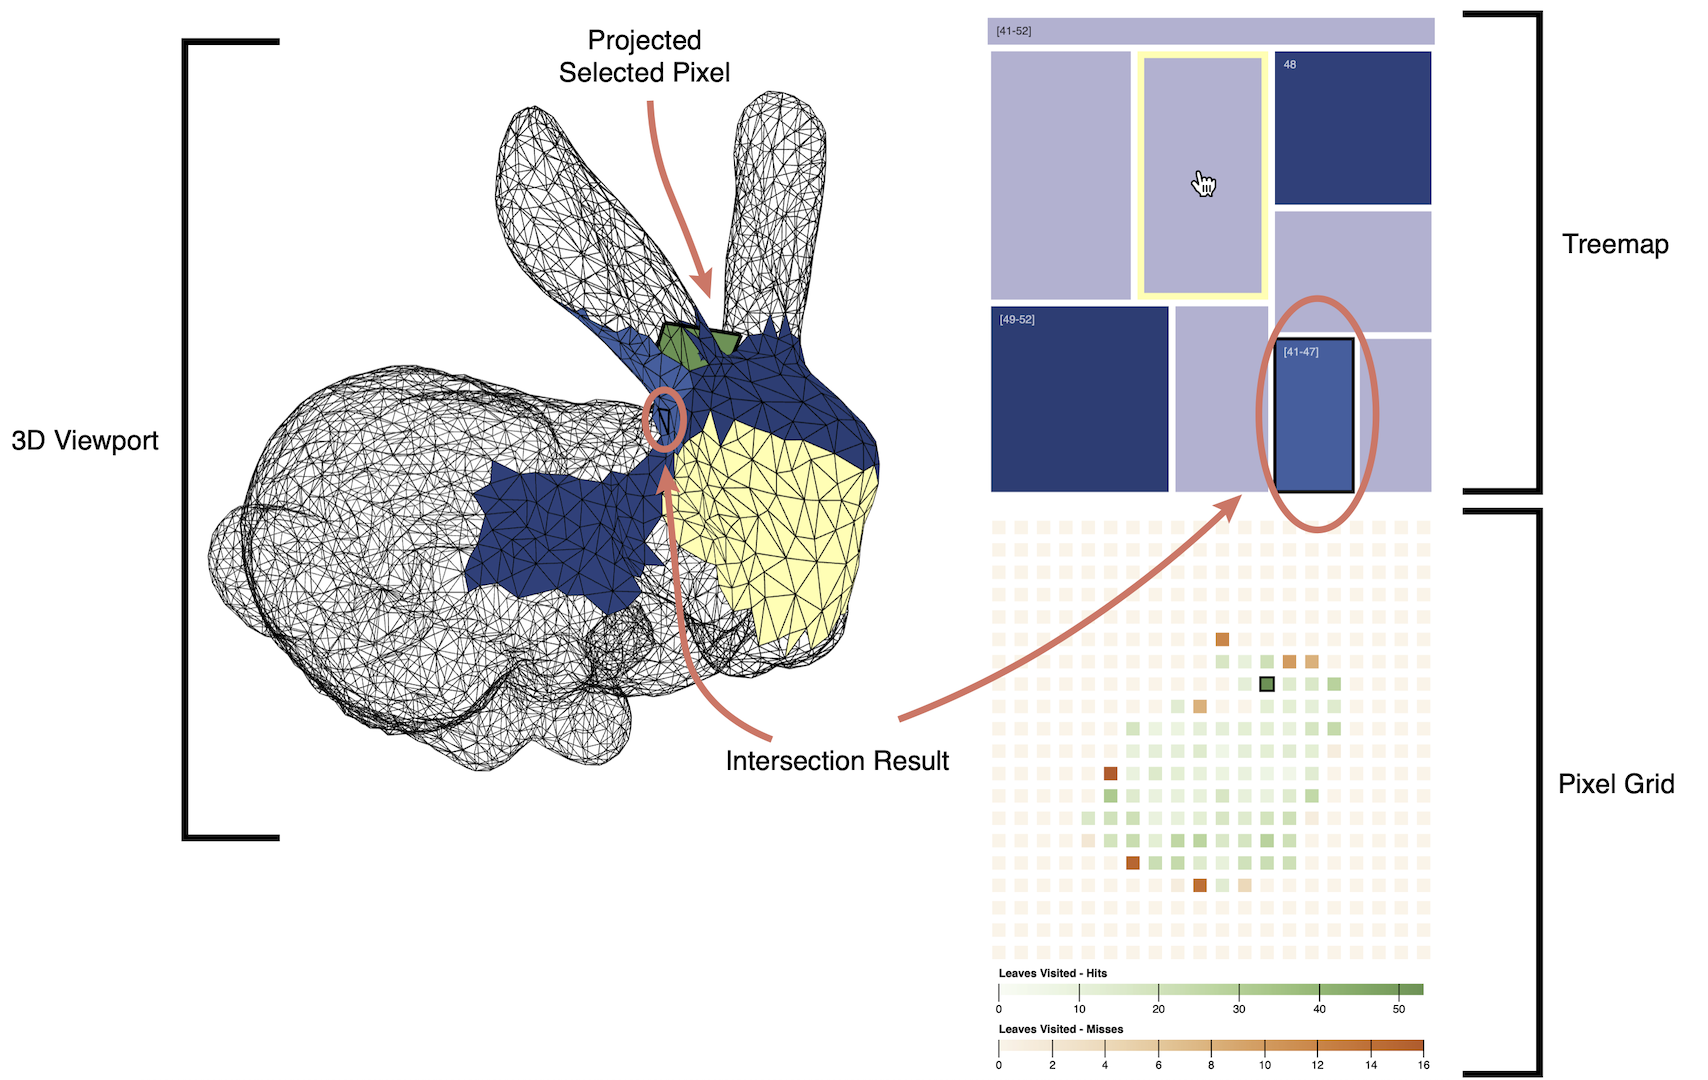
Bounding volume hierarchies (BVHs) are one of the most common spatial data structures in computer graphics. Visualizing ray intersections in these data structures is challenging due to the large number of queries in typical image rendering workloads, the spatial clutter induced by superimposing the tree in a 3D viewport, and the strong tendency of these queries to visit several tree leaves, all of which add a very high dimensionality to the data being visualized. We present a new technique for visualizing ray intersection traversals on BVHs over triangle meshes. Unlike previous approaches which display aggregate traversal costs using a heatmap over the rendered image, we display detailed traversal information about individual queries, using a 3D view of the mesh, a treemap of the BVH, and synchronized highlighting between the two views, along with a pixel grid to select a ray intersection query to view. We demonstrate how this technique elucidates traversal dynamics and tree construction properties, which makes it possible to easily spot algorithmic improvements in these two categories.