Visual Analysis of Large Multi-Field AMR Data on GPUs Using Interactive Volume Lines
Stefan Zellmann, Serkan Demirci, Ugur Gudukbay
Room: 104
2023-10-25T03:09:00ZGMT-0600Change your timezone on the schedule page
2023-10-25T03:09:00Z
Fast forward
Full Video
Keywords
Human-centered computing—Visualization—Visualization application domains—Visual analytics; Human-centered computing—Visualization—Visualization application domains—Scientific visualization
Abstract
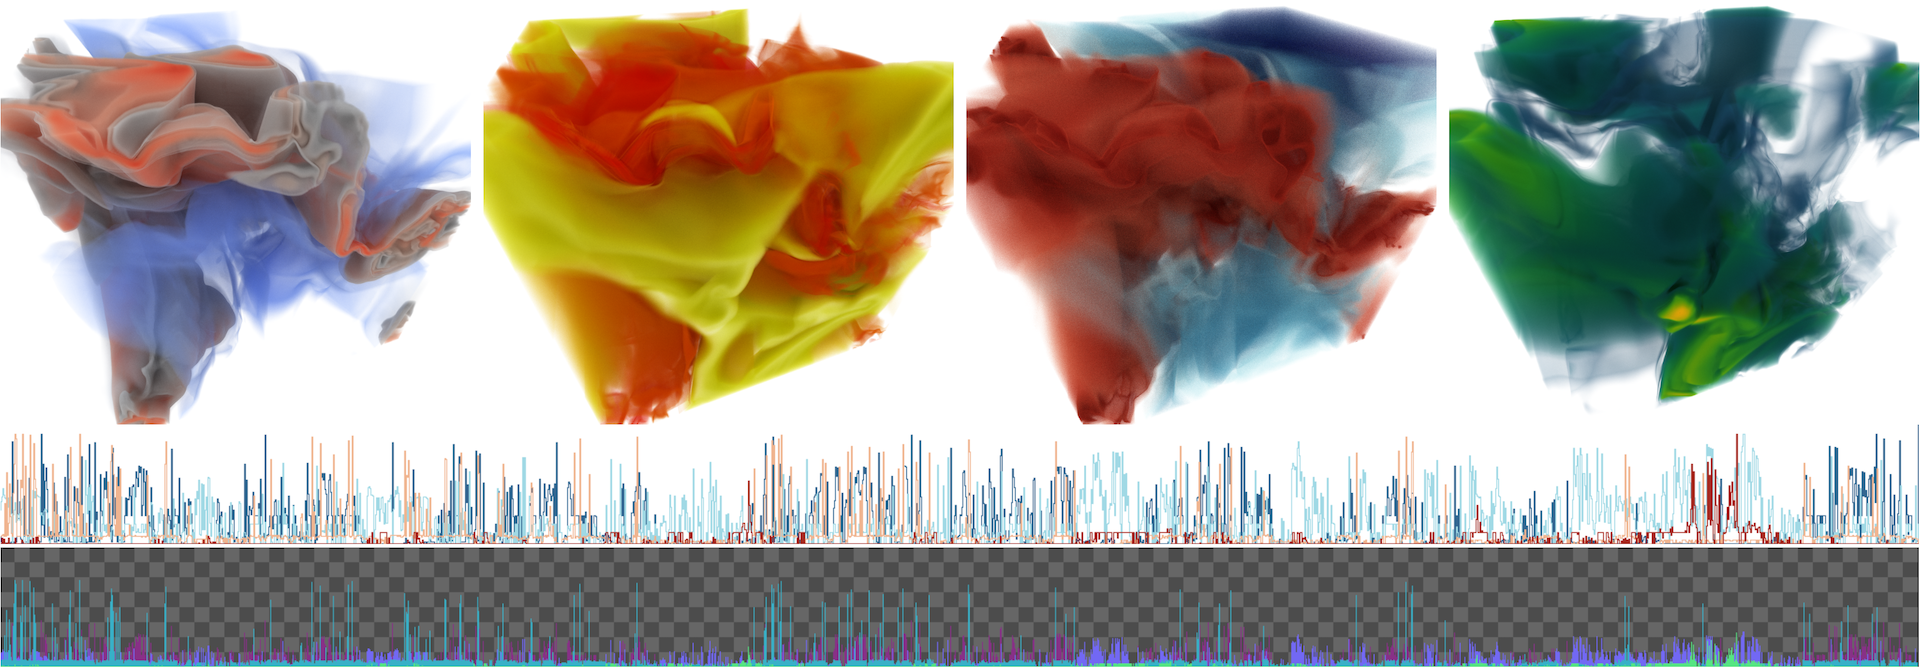
To visually compare ensembles of volumes, dynamic volume lines (DVLs) represent each ensemble member as a 1D polyline. To compute these, the volume cells are sorted on a space-filling curve and scaled by the ensemble’s local variation. The resulting 1D plot can augment or serve as an alternative to a 3D volume visualization free of visual clutter and occlusion. Interactively computing DVLs is challenging when the data is large, and the volume grid is not structured/regular, as is often the case with computational fluid dynamics simulations. We extend DVLs to support large-scale, multi-field adaptive mesh refinement (AMR) data that can be explored interactively. Our GPU-based system updates the DVL representation whenever the data or the alpha transfer function changes. We demonstrate and evaluate our interactive prototype using large AMR volumes from astrophysics simulations.