Explain-and-Test: An Interactive Machine Learning Framework for Exploring Text Embeddings
Shivam Raval, Carolyn Ann Wang, Fernanda Viegas, Martin Wattenberg
Room: 104
2023-10-26T22:00:00ZGMT-0600Change your timezone on the schedule page
2023-10-26T22:00:00Z
Fast forward
Full Video
Keywords
Text Visualization, Dimensionality Reduction, Clustering—Large Language Models—Explanation—
Abstract
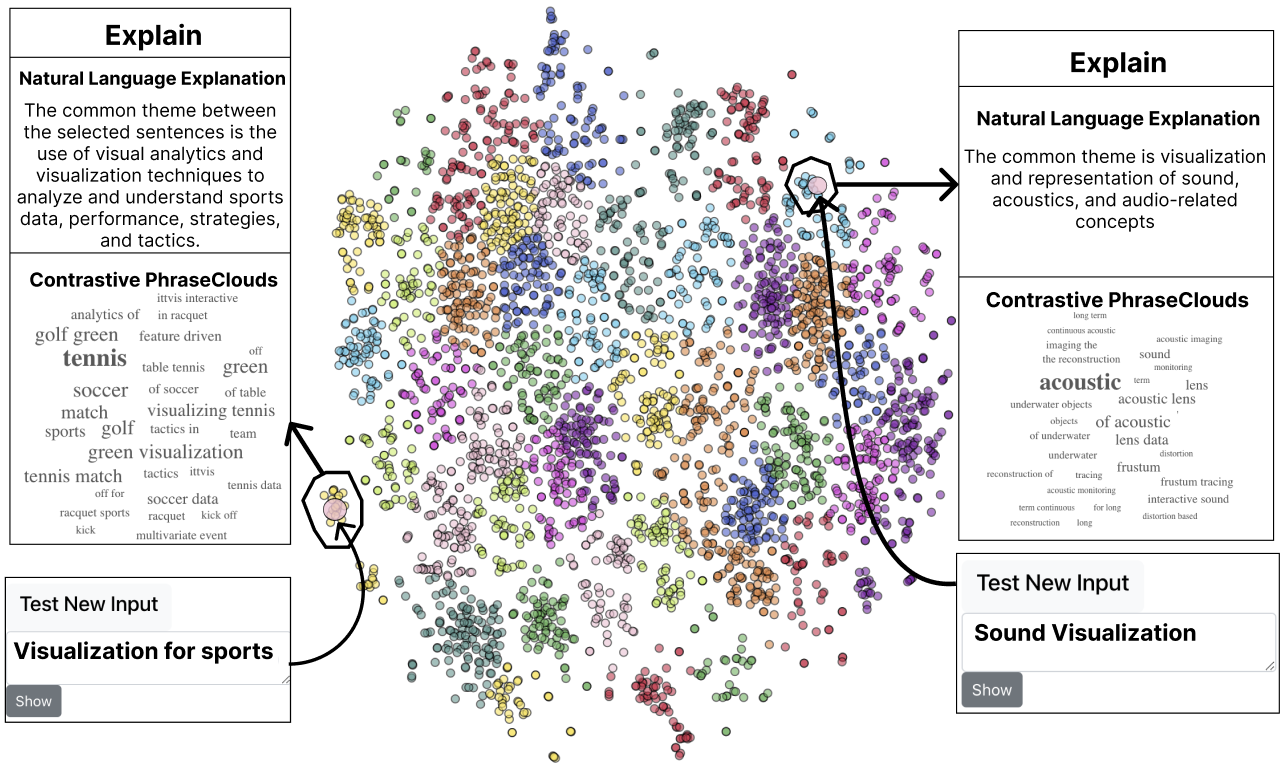
TextCluster Explainer visualizes text embeddings, allowing users to lasso clusters of interest to get automated explanations of these clusters. The system provides two kinds of explanations: Contrastive PhraseClouds generated by an SVM model and Natural Language Explanations generated by a large language model (GPT-4). Users can test these automated explanations by entering manual labels to be dynamically embedded into the visualization, a feature we call Assessment by Re-projection. If the new text is mapped to the cluster, it validates the automated explanation. The figure shows a t-SNE projection where each point corresponds to the paper title from the Visualization Publications dataset along along with explanations and test inputs for two different clusters. The color encoding corresponds to labels predicted by clustering the projections.