Visual Validation versus Visual Estimation: A Study on the Average Value in Scatterplots
Daniel Braun, Ashley Suh, Remco Chang, Michael Gleicher, Tatiana von Landesberger
Room: 104
2023-10-26T03:18:00ZGMT-0600Change your timezone on the schedule page
2023-10-26T03:18:00Z
Fast forward
Full Video
Keywords
Perception, Visual model validation, Visual model estimation, User study, Information visualization
Abstract
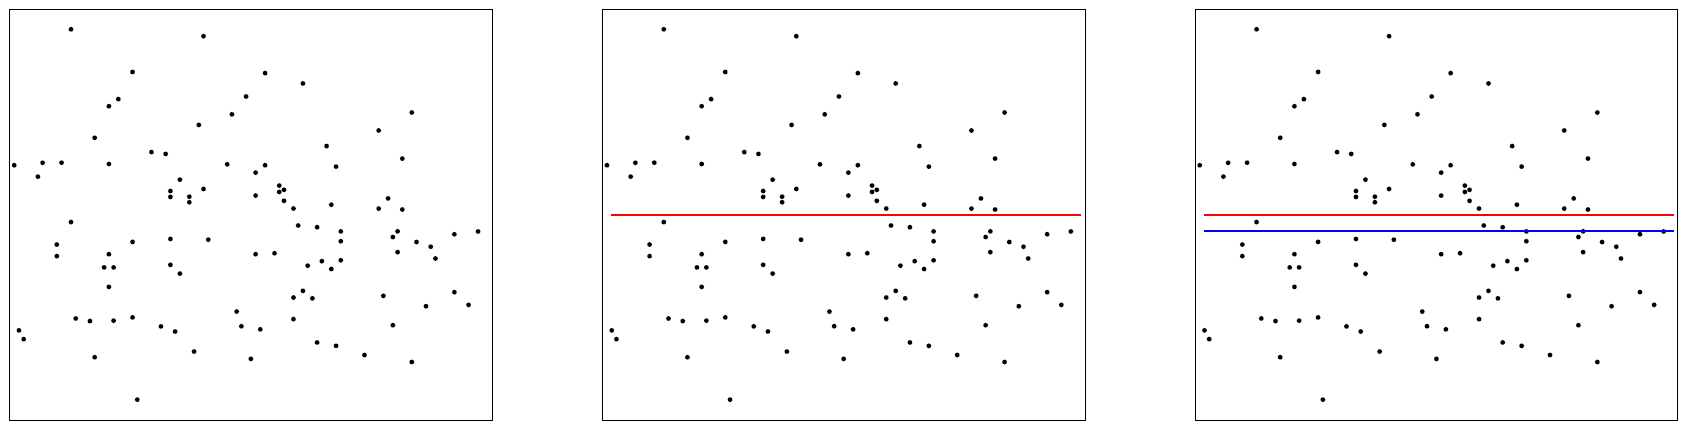
We investigate the ability of individuals to visually validate statistical models in terms of their fit to the data. While visual model estimation has been studied extensively, visual model validation remains under-investigated. It is unknown how well people are able to visually validate models, and how their performance compares to visual and computational estimation. As a starting point, we conducted a study across two populations (crowdsourced and volunteers). Participants had to both visually estimate (i.e, draw) and visually validate (i.e., accept or reject) the frequently studied model of averages. Across both populations, the level of accuracy of the models that were considered valid was lower than the accuracy of the estimated models. We find that participants’ validation and estimation were unbiased. Moreover, their natural critical point between accepting and rejecting a given mean value is close to the boundary of its 95% confidence interval, indicating that the visually perceived confidence interval corresponds to a common statistical standard. Our work contributes to the understanding of visual model validation and opens new research opportunities.