GeneticFlow: Exploring Scholar Impact with Interactive Visualization
Fengli Xiao, Lei Shi
Room: 104
2023-10-25T03:27:00ZGMT-0600Change your timezone on the schedule page
2023-10-25T03:27:00Z
Fast forward
Full Video
Keywords
Computing: Software, Networks, Security, Performance Engr., Distr. Systems, Databases ; Graph/Network and Tree Data
Abstract
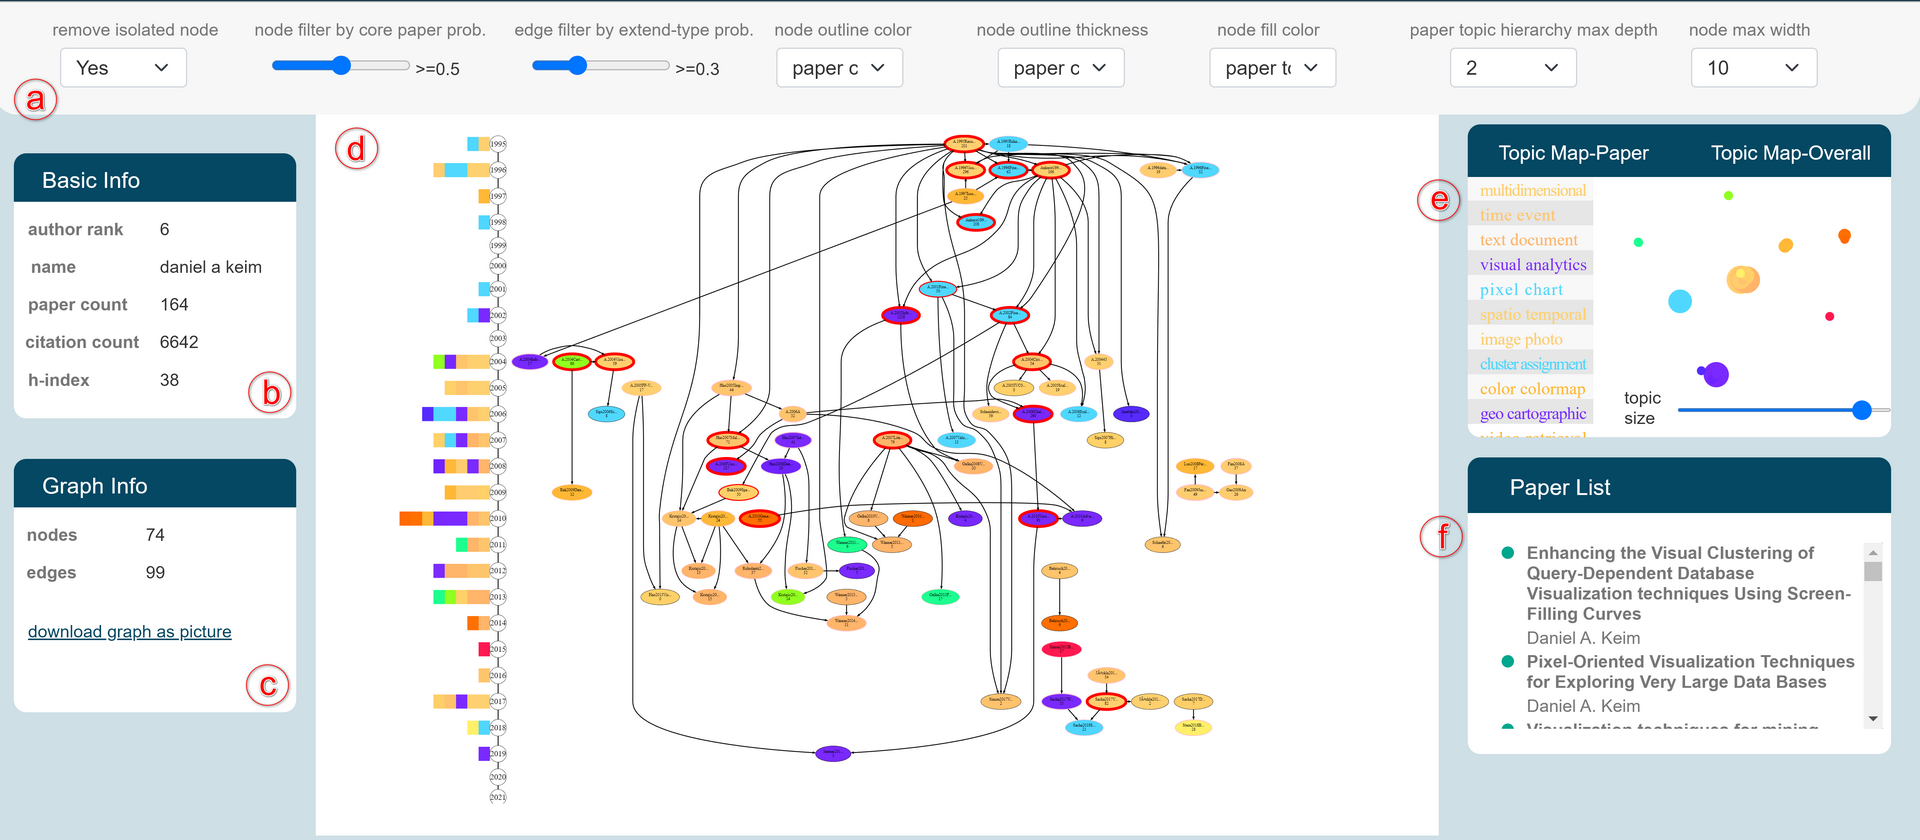
Visualizing a scholar's scientific impact is important for many challenging tasks in academia such as tenure evaluation and award selection. Existing visualization and profiling approaches do not focus on the analysis of individual scholar's impact, or they are too abstract to provide detailed interpretation of high-impact scholars. This work builds over a new scholar-centric impact-oriented profiling method called GeneticFlow. We propose a visualization design of scholar's self-citation graphs using a time-dependent, hierarchical representation method. The graph visualization is augmented with color-coded topic information trained with cutting-edge deep learning techniques, and also temporal trend chart to illustrate the dynamics of topic/impact evolution. The visualization method is validated on a benchmark dataset established for the visualization field. Visualization results reveal key patterns of high-impact scholars and also demonstrate its capability to serve ordinary researchers for their impact visualization task.