Best Paper Award
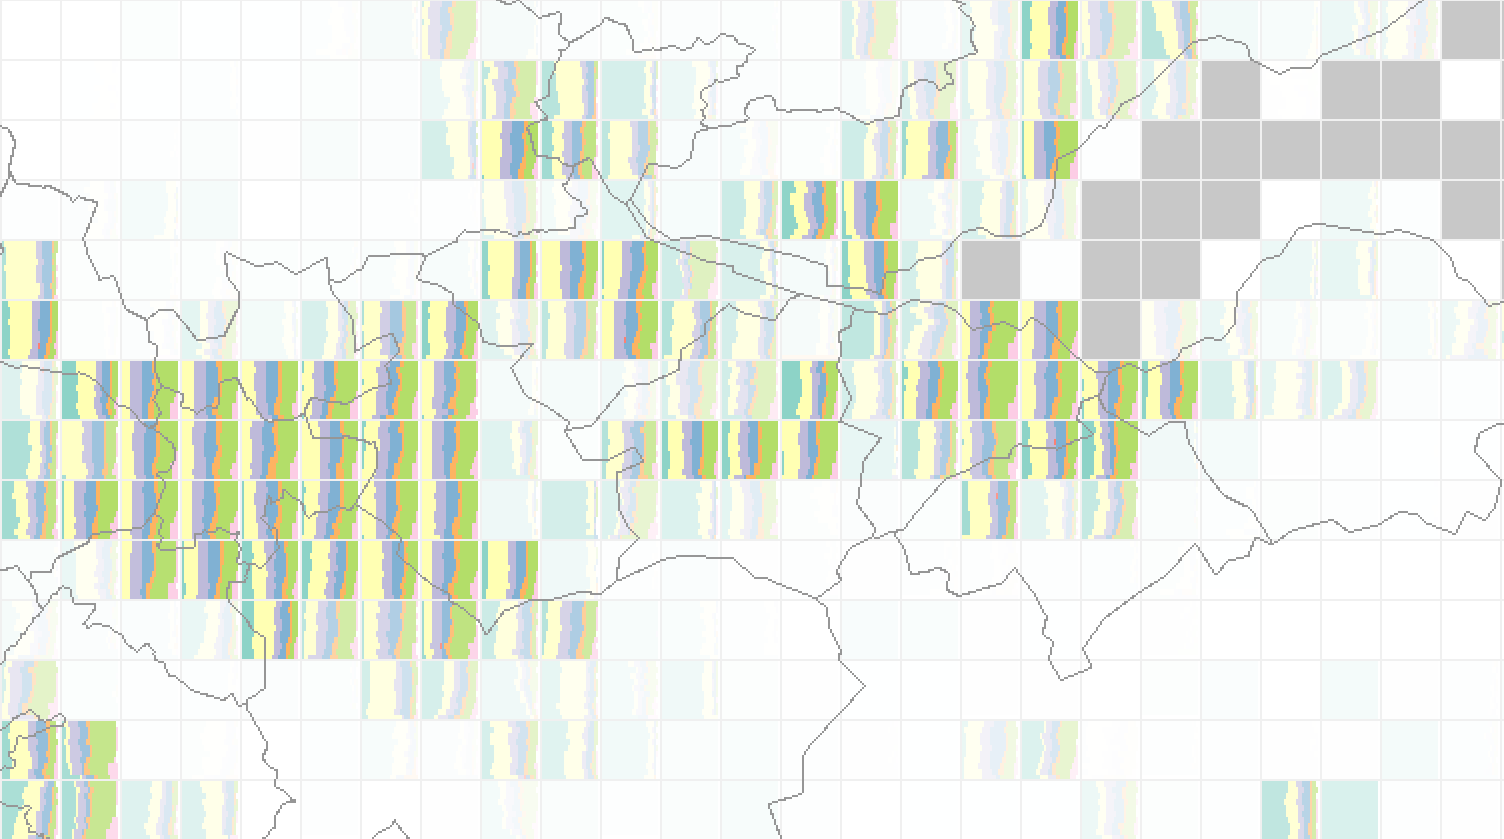
Gridded Glyphmaps for Supporting Spatial COVID-19 Modelling
Aidan Slingsby, Richard Reeve, Claire Harris
Room: Plenary-1
2023-10-24T05:25:00ZGMT-0600Change your timezone on the schedule page
2023-10-24T05:25:00Z
Fast forward
Full Video
Keywords
Modelling, spatial, temporal, COVID-19, interaction.
Abstract
We describe our use of gridded glyphmaps to support development of a repurposed COVID-19 infection model during the height of the pandemic. We found that gridded glyphmaps' ability to interactive summarise multivariate model input, intermediate results and outputs across multiple scales supported our model development tasks in ways that the modellers had not previously seen. We recount our experiences, reflect on potential to support more spatial model development more generally and suggest areas of further work.