Reasoning Affordances with Tables and Bar Charts
Cindy Xiong Bearfield, Elsie Lee-Robbins, Icy Zhang, Aimen Gaba, Steven L Franconeri
DOI: 10.1109/TVCG.2022.3232959
Room: 109
2023-10-24T23:45:00ZGMT-0600Change your timezone on the schedule page
2023-10-24T23:45:00Z

Fast forward
Full Video
Keywords
Data visualization;Tabular displays;Empirical evaluation;Reasoning
Abstract
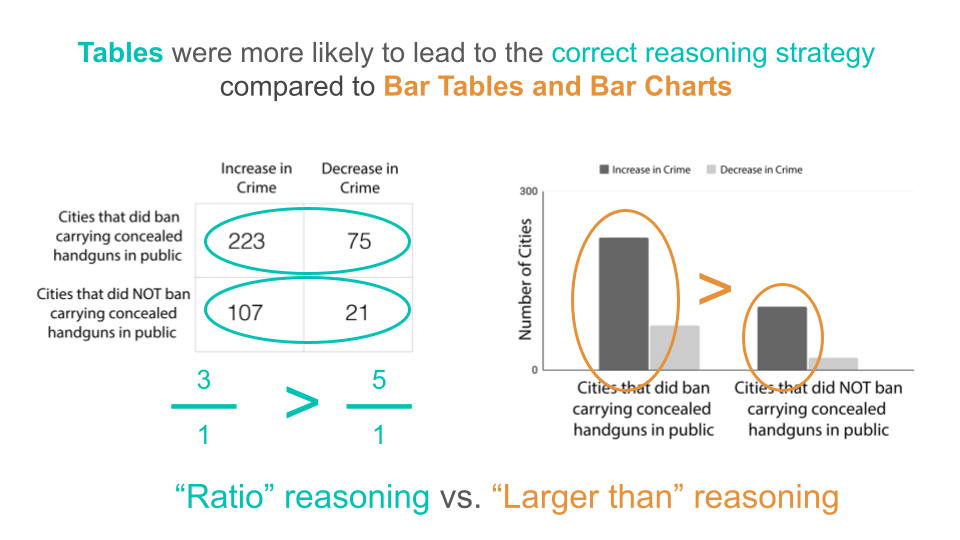
A viewer’s existing beliefs can prevent accurate reasoning with data visualizations. In particular, confirmation bias can cause people to overweigh information that confirms their beliefs, and dismiss information that disconfirms them. We tested whether confirmation bias exists when people reason with visualized data and whether certain visualization designs can elicit less biased reasoning strategies. We asked crowd workers to solve reasoning problems that had the potential to evoke both poor reasoning strategies and confirmation bias. We created two scenarios, one in which we primed people with a belief before asking them to make a decision, and another in which people held pre-existing beliefs. The data was presented as either a table, a bar table, or a bar chart. To correctly solve the problem, participants should use a complex reasoning strategy to compare two ratios, each between two pairs of values. But participants could also be tempted to use simpler, superficial heuristics, shortcuts, or biased strategies to reason about the problem. Presenting the data in a table format helped participants reason with the correct ratio strategy while showing the data as a bar table or a bar chart led participants towards incorrect heuristics. Confirmation bias was not significantly present when beliefs were primed, but it was present when beliefs were pre-existing. Additionally, the table presentation format was more likely to afford the ratio reasoning strategy, and the use of the ratio strategy was more likely to lead to the correct answer. These findings suggest that data presentation formats can affect affordances for reasoning.