XNLI: Explaining and Diagnosing NLI-based Visual Data Analysis
Yingchaojie Feng, Xingbo Wang, Bo Pan, Kam Kwai Wong, Yi Ren, Shi Liu, Zihan Yan, Yuxin Ma, Huamin Qu, Wei Chen
DOI: 10.1109/TVCG.2023.3240003
Room: 109
2023-10-25T22:48:00ZGMT-0600Change your timezone on the schedule page
2023-10-25T22:48:00Z
Fast forward
Full Video
Keywords
Natural language interface;visual data analysis;explainability
Abstract
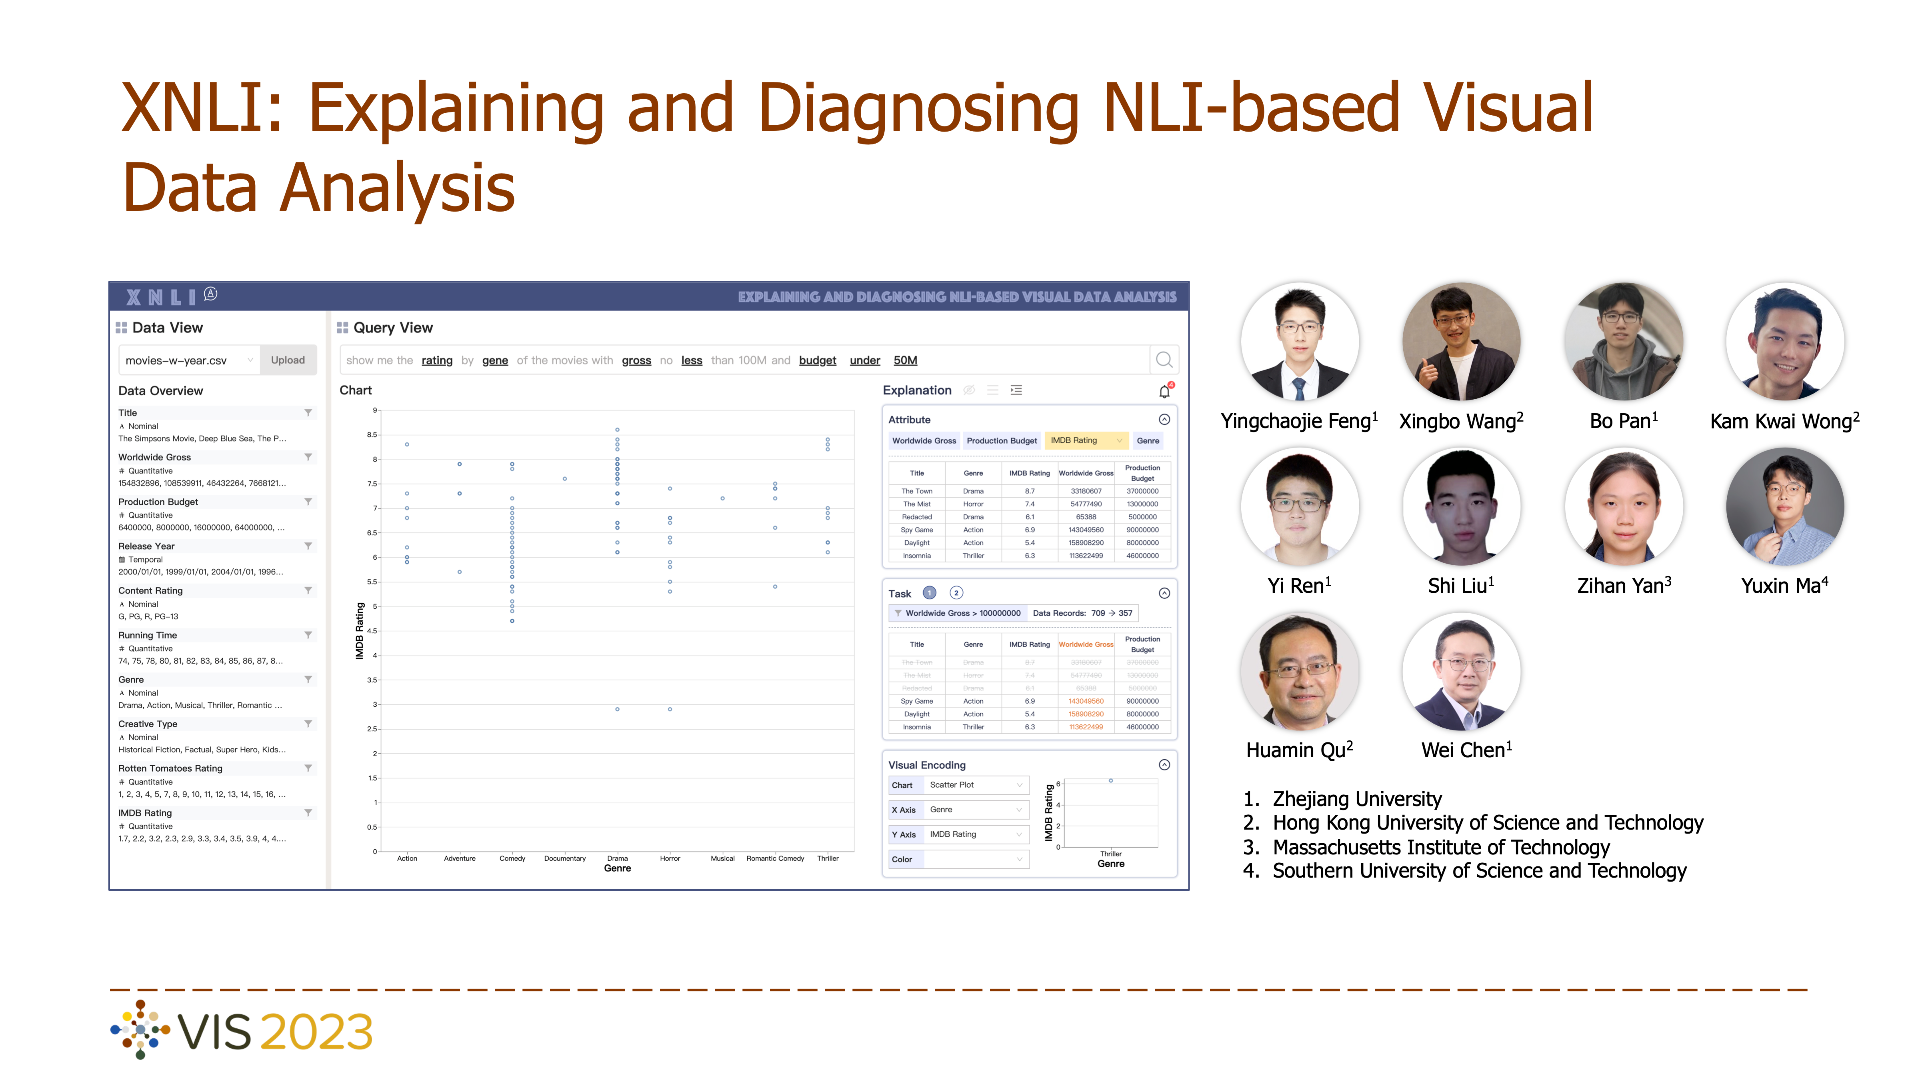
Natural language interfaces (NLIs) enable users to flexibly specify analytical intentions in data visualization. However, diagnosing the visualization results without understanding the underlying generation process is challenging. Our research explores how to provide explanations for NLIs to help users locate the problems and further revise the queries. We present XNLI, an explainable NLI system for visual data analysis. The system introduces a Provenance Generator to reveal the detailed process of visual transformations, a suite of interactive widgets to support error adjustments, and a Hint Generator to provide query revision hints based on the analysis of user queries and interactions. Two usage scenarios of XNLI and a user study verify the effectiveness and usability of the system. Results suggest that XNLI can significantly enhance task accuracy without interrupting the NLI-based analysis process.