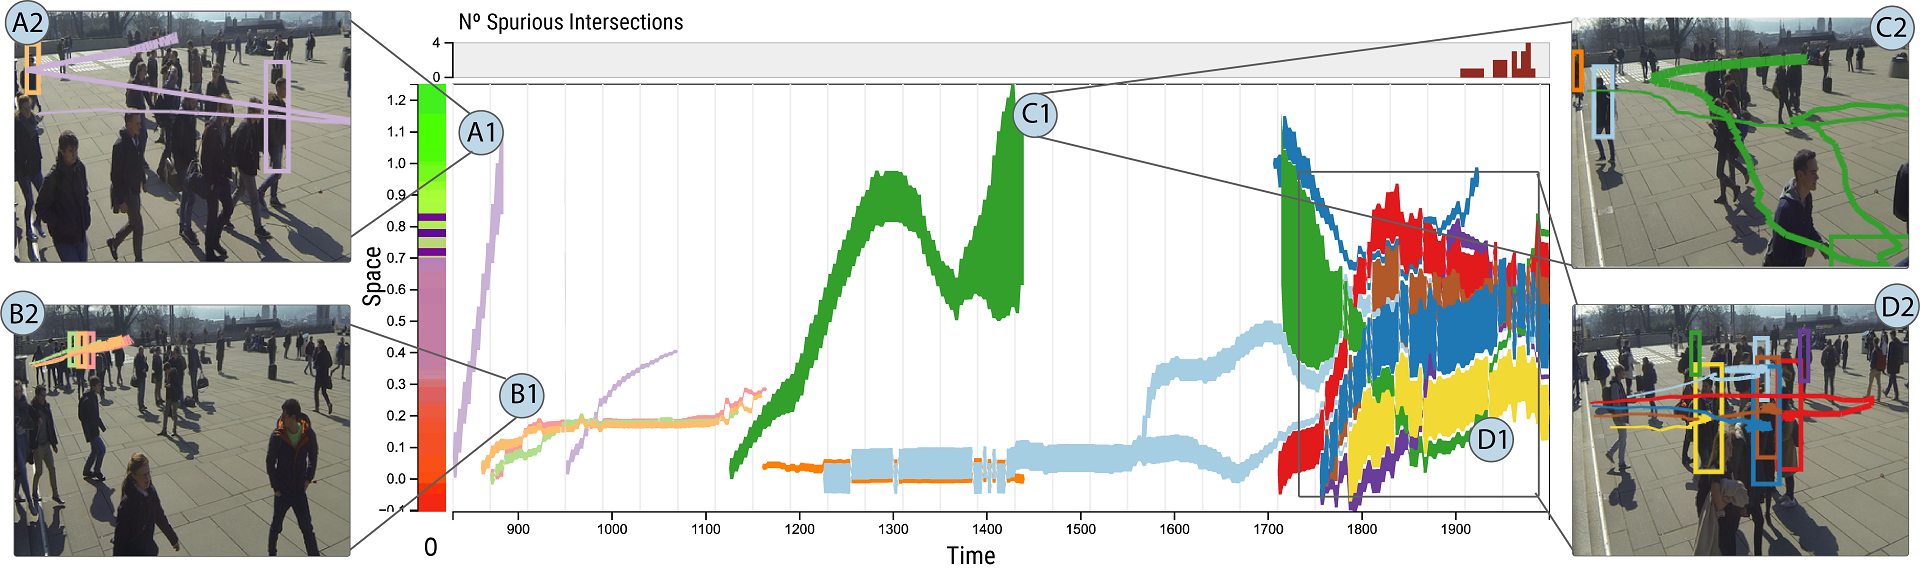
MoReVis: A Visual Summary for Spatiotemporal Moving Regions
Giovani Valdrighi, Nivan Ferreira, Jorge Poco
DOI: 10.1109/TVCG.2023.3250166
Room: 105
2023-10-26T22:12:00ZGMT-0600Change your timezone on the schedule page
2023-10-26T22:12:00Z
Fast forward
Full Video
Keywords
Spatiotemporal visualization;spatial interactions;spatial abstraction
Abstract
Spatial and temporal interactions are central and fundamental in many activities in our world. A common problem faced when visualizing this type of data is how to provide an overview that helps users navigate efficiently. Traditional approaches use coordinated views or 3D metaphors like the Space-time cube to tackle this problem. However, they suffer from overplotting and often lack spatial context, hindering data exploration. More recent techniques, such as MotionRugs, propose compact temporal summaries based on 1D projection. While powerful, these techniques do not support the situation for which the spatial extent of the objects and their intersections is relevant, such as the analysis of surveillance videos or tracking weather storms. In this paper, we propose MoReVis, a visual overview of spatiotemporal data that considers the objects' spatial extent and strives to show spatial interactions among these objects by displaying spatial intersections. Like previous techniques, our method involves projecting the spatial coordinates to 1D to produce compact summaries. However, our solution's core consists of performing a layout optimization step that sets the size and positions of the visual marks on the summary to resemble the actual values on the original space. We also provide multiple interactive mechanisms to make interpreting the results more straightforward for the user. We perform an extensive experimental evaluation and usage scenarios. Moreover, we evaluated the usefulness of MoReVis in a study with 9 participants. The results point out the effectiveness and suitability of our method in representing different datasets compared to traditional techniques.