The Risks of Ranking: Revisiting Graphical Perception to Model Individual Differences in Visualization Performance
Russell Davis, Xiaoying Pu, Yiren Ding, Brian D. Hall, Karen Bonilla, Mi Feng, Matthew Kay, Lane Harrison
DOI: 10.1109/TVCG.2022.3226463
Room: 105
2023-10-26T03:00:00ZGMT-0600Change your timezone on the schedule page
2023-10-26T03:00:00Z
Fast forward
Full Video
Keywords
visualization;graphical perception;individual differences
Abstract
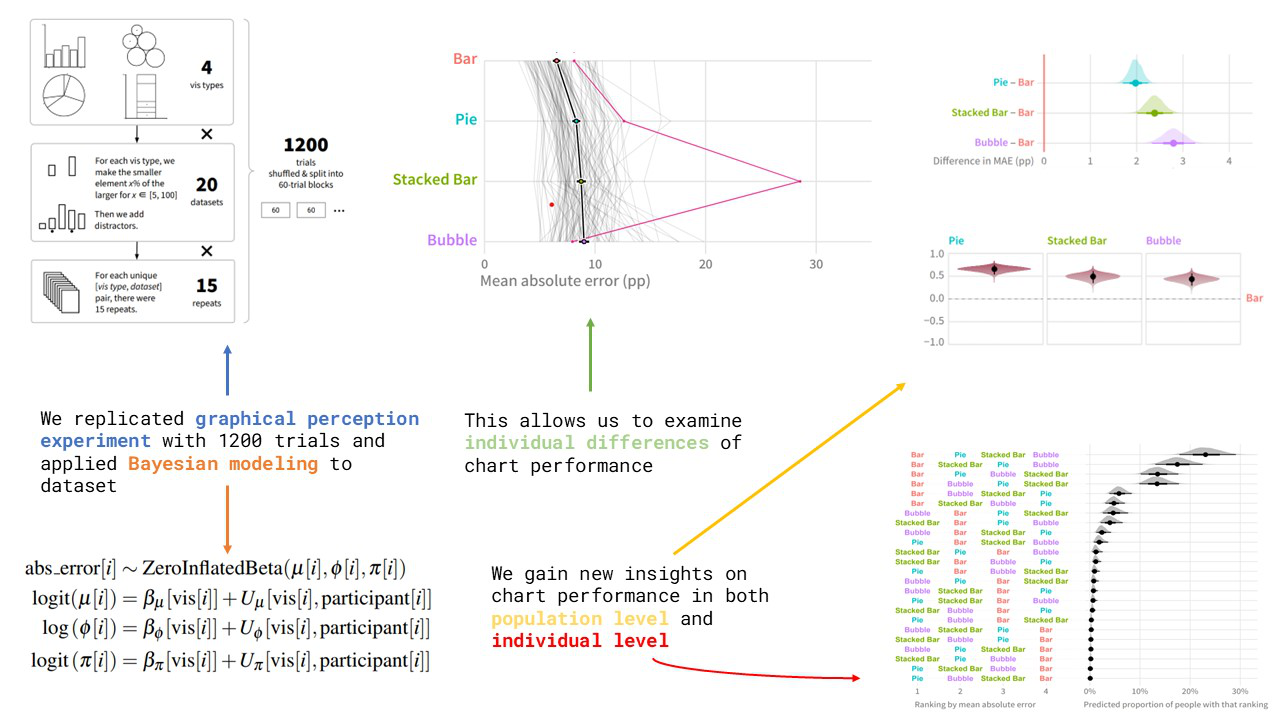
Graphical perception studies typically measure visualization encoding effectiveness using the error of an “average observer”, leading to canonical rankings of encodings for numerical attributes: e.g., position > area > angle > volume. Yet different people may vary in their ability to read different visualization types, leading to variance in this ranking across individuals not captured by population-level metrics using “average observer” models. One way we can bridge this gap is by recasting classic visual perception tasks as tools for assessing individual performance, in addition to overall visualization performance. In this paper we replicate and extend Cleveland and McGill’s graphical comparison experiment using Bayesian multilevel regression, using these models to explore individual differences in visualization skill from multiple perspectives. The results from experiments and modeling indicate that some people show patterns of accuracy that credibly deviate from the canonical rankings of visualization effectiveness. We discuss implications of these findings, such as a need for new ways to communicate visualization effectiveness to designers, how patterns in individuals’ responses may show systematic biases and strategies in visualization judgment, and how recasting classic visual perception tasks as tools for assessing individual performance may offer new ways to quantify aspects of visualization literacy. Experiment data, source code, and analysis scripts are available at the following repository: https://osf.io/8ub7t/?view_only=9be4798797404a4397be3c6fc2a68cc0.