From Invisible to Visible: Impacts of Metadata in Communicative Data Visualization
Alyxander Burns, Christiana Lee, Thai On, Cindy Xiong Bearfield, Evan Peck, Narges Mahyar
DOI: 10.1109/TVCG.2022.3231716
Room: 105
2023-10-24T22:00:00ZGMT-0600Change your timezone on the schedule page
2023-10-24T22:00:00Z
Fast forward
Full Video
Keywords
Visualization;metadata;understanding;transparency;trust
Abstract
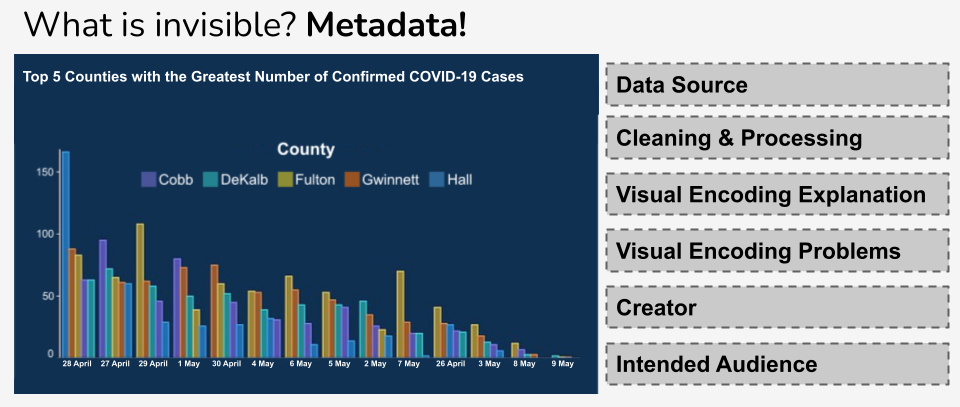
Leaving the context of visualizations invisible can have negative impacts on understanding and transparency. While common wisdom suggests that recontextualizing visualizations with metadata (e.g., disclosing the data source or instructions for decoding the visualizations' encoding) may counter these effects, the impact remains largely unknown. To fill this gap, we conducted two experiments. In Experiment 1, we explored how chart type, topic, and user goal impacted which categories of metadata participants deemed most relevant. We presented 64 participants with four real-world visualizations. For each visualization, participants were given four goals and selected the type of metadata they most wanted from a set of 18 types. Our results indicated that participants were most interested in metadata which explained the visualization's encoding for goals related to understanding and metadata about the source of the data for assessing trustworthiness. In Experiment 2, we explored how these two types of metadata impact transparency, trustworthiness and persuasiveness, information relevance, and understanding. We asked 144 participants to explain the main message of two pairs of visualizations (one with metadata and one without); rate them on scales of transparency and relevance; and then predict the likelihood that they were selected for a presentation to policymakers. Our results suggested that visualizations with metadata were perceived as more thorough than those without metadata, but similarly relevant, accurate, clear, and complete. Additionally, we found that metadata did not impact the accuracy of the information extracted from visualizations, but may have influenced which information participants remembered as important or interesting.