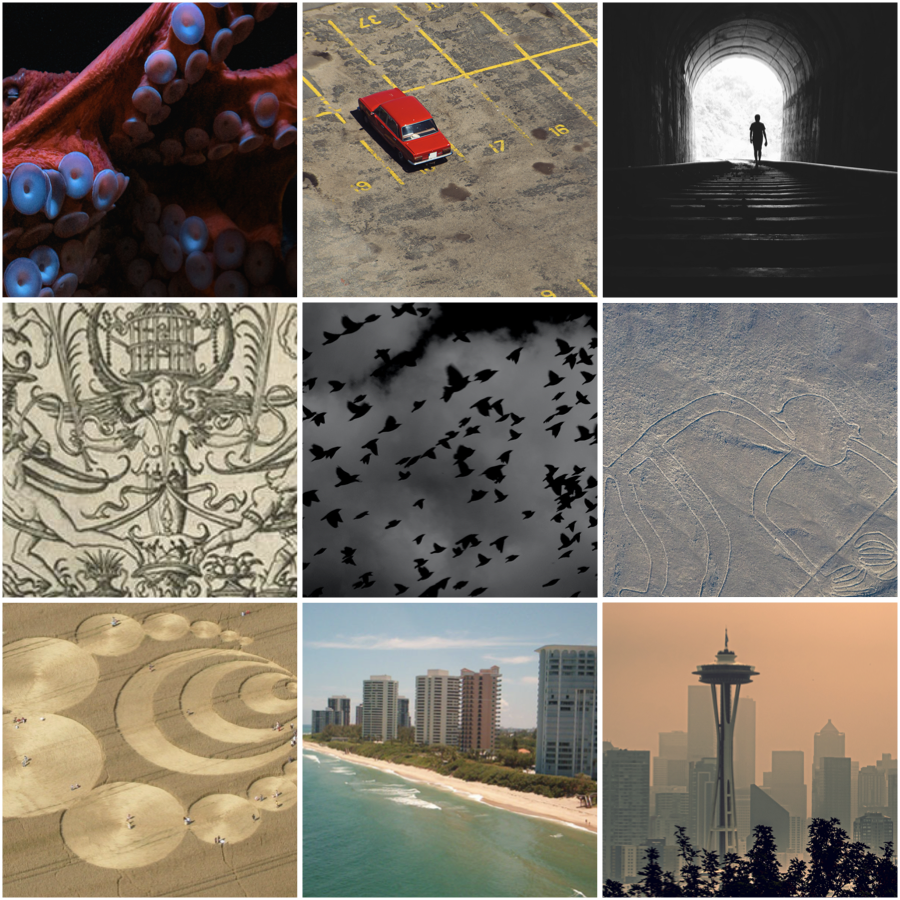
Visualizing the Weird and the Eerie
Room: 110
2023-10-23T03:00:00ZGMT-0600Change your timezone on the schedule page
2023-10-23T03:00:00Z
Abstract
In this brief essay, I reflect on how Mark Fisher's definitions of the weird and the eerie could be applied in communicative data visualization. I ask how visualization designers might elicit these two impressions when a viewer is engaging with multimodal representations of data. I argue that there are situations in which viewers should feel uncertain or suspicious of unseen forces that account for the presence or absence of audiovisual patterns. Finally, I conclude that the ability to appreciate the weird and the eerie in data is particularly important at this moment in history, one marked by significant ecological and economic disruption.