Visualizing Scalar Effects of Urban Data Aggregation
Jonathan K Nelson
Room: 103
2023-10-22T03:00:00ZGMT-0600Change your timezone on the schedule page
2023-10-22T03:00:00Z
Abstract
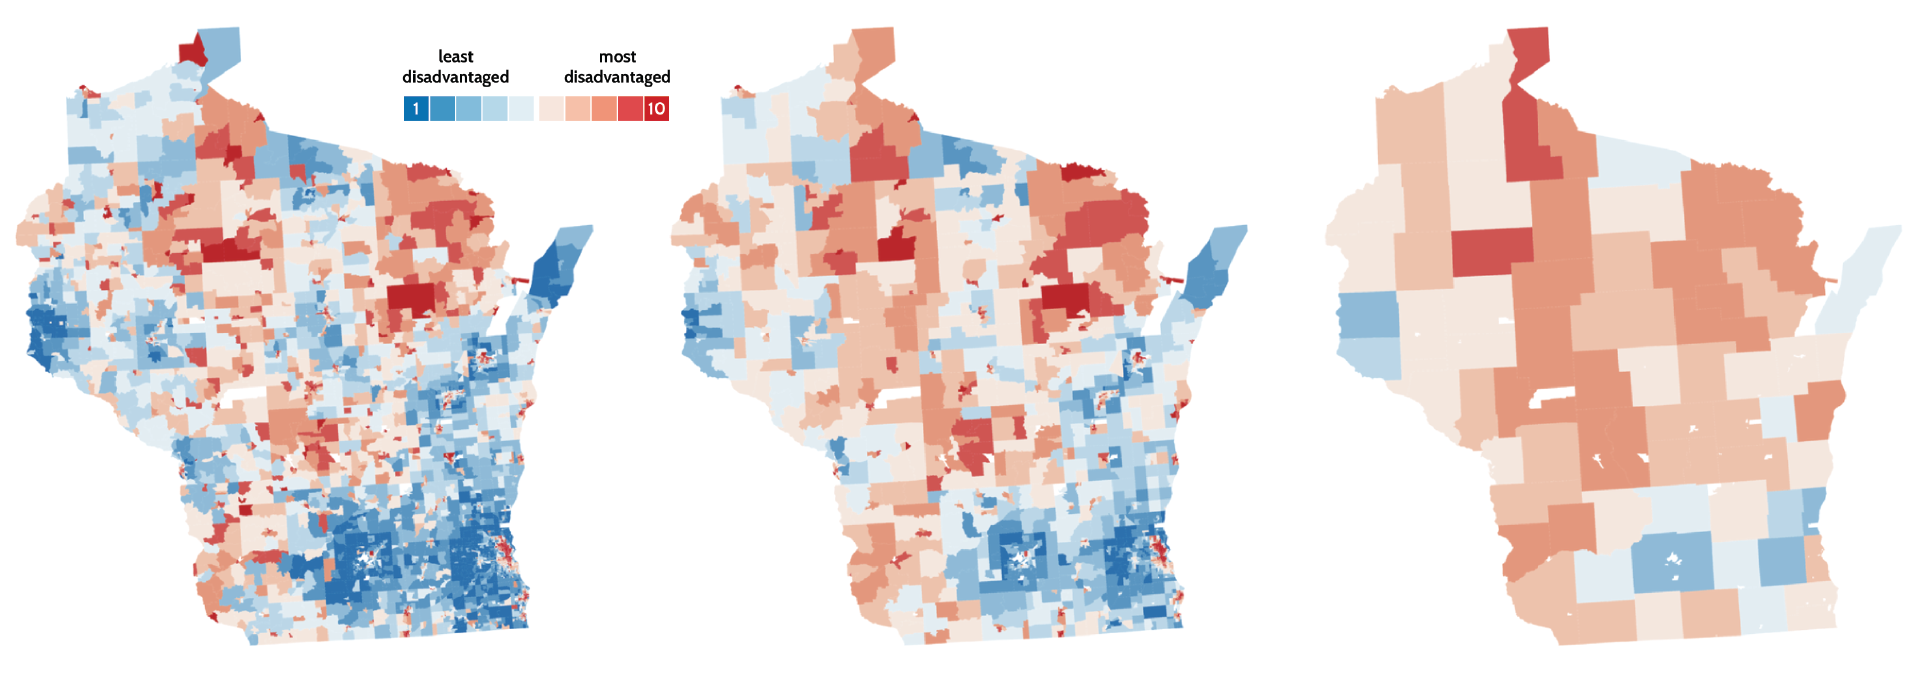
The process of geospatial data aggregation provides a means for abstracting the complexity of urban systems to not just better understand them, but also protect the privacy of the individuals within them. However, level of aggregation and the arbitrary sizes, shapes, and arrangements of areal units may lead to statistical and visual bias that affects the reliability and validity of findings derived from the analysis of areally aggregated urban data. This bias and resulting analytical uncertainty – known as the Modifiable Areal Unit Problem (MAUP) – has implications for public policy implementation and allocation of critical resources in both urban and rural areas. Despite a wealth of geographic research on MAUP and development of advanced statistical approaches to quantifying its effects, many of these insights and techniques remain largely inaccessible and subsequently unadopted by GIS professionals working on city planning applications. This paper introduces a simple vector-to-raster choropleth mapping workflow that enables a broad range of urban analysts to visually assess the scalar effects of the modifiable areal unit problem.