Visualization of the Oscillatory Dynamics of an Island Power System
Sam Molnar, Kenny Gruchalla, Shuan Dong, Jin Tan
Room: 103
2023-10-21T22:00:00ZGMT-0600Change your timezone on the schedule page
2023-10-21T22:00:00Z
Abstract
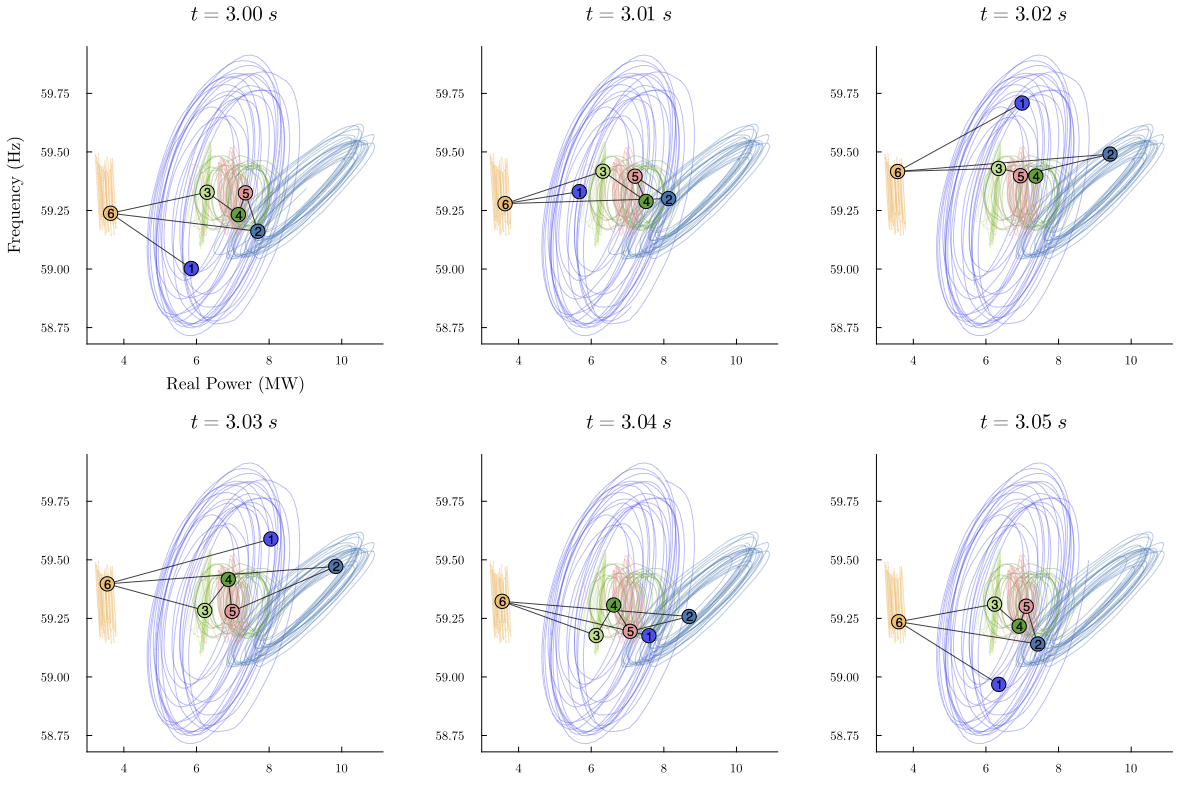
In this work, we discuss the design of visualizations for understand- ing the complex oscillatory dynamics of an island power system with renewable generation sources after the loss of a large oil power plant. As more renewable generation sources are added to power systems, the oscillatory dynamics will change, which requires new visualization techniques to determine causes and strategies to avoid unwanted behaviors in the future. Our approach integrates geo- graphic views, time-series plots, and novel oscillatory-trajectory curves, providing unique insights into the interdependent oscillatory behaviors of multiple state variables and generators over time. By enabling multi-node and multivariate comparisons over time, users can qualitatively determine drivers of oscillations and differences in generator dynamics, which is not possible with other commonly used visualization techniques.