Comparing Mapper Graphs of Artificial Neuron Activations
Youjia Zhou, Helen Jenne, Davis Brown, Madelyn R Shapiro, Brett A Jefferson, Cliff Joslyn, Gregory Henselman-Petrusek, Brenda Praggastis, Emilie Purvine, Bei Wang
Room: 106
2023-10-22T03:00:00ZGMT-0600Change your timezone on the schedule page
2023-10-22T03:00:00Z
Fast forward
Abstract
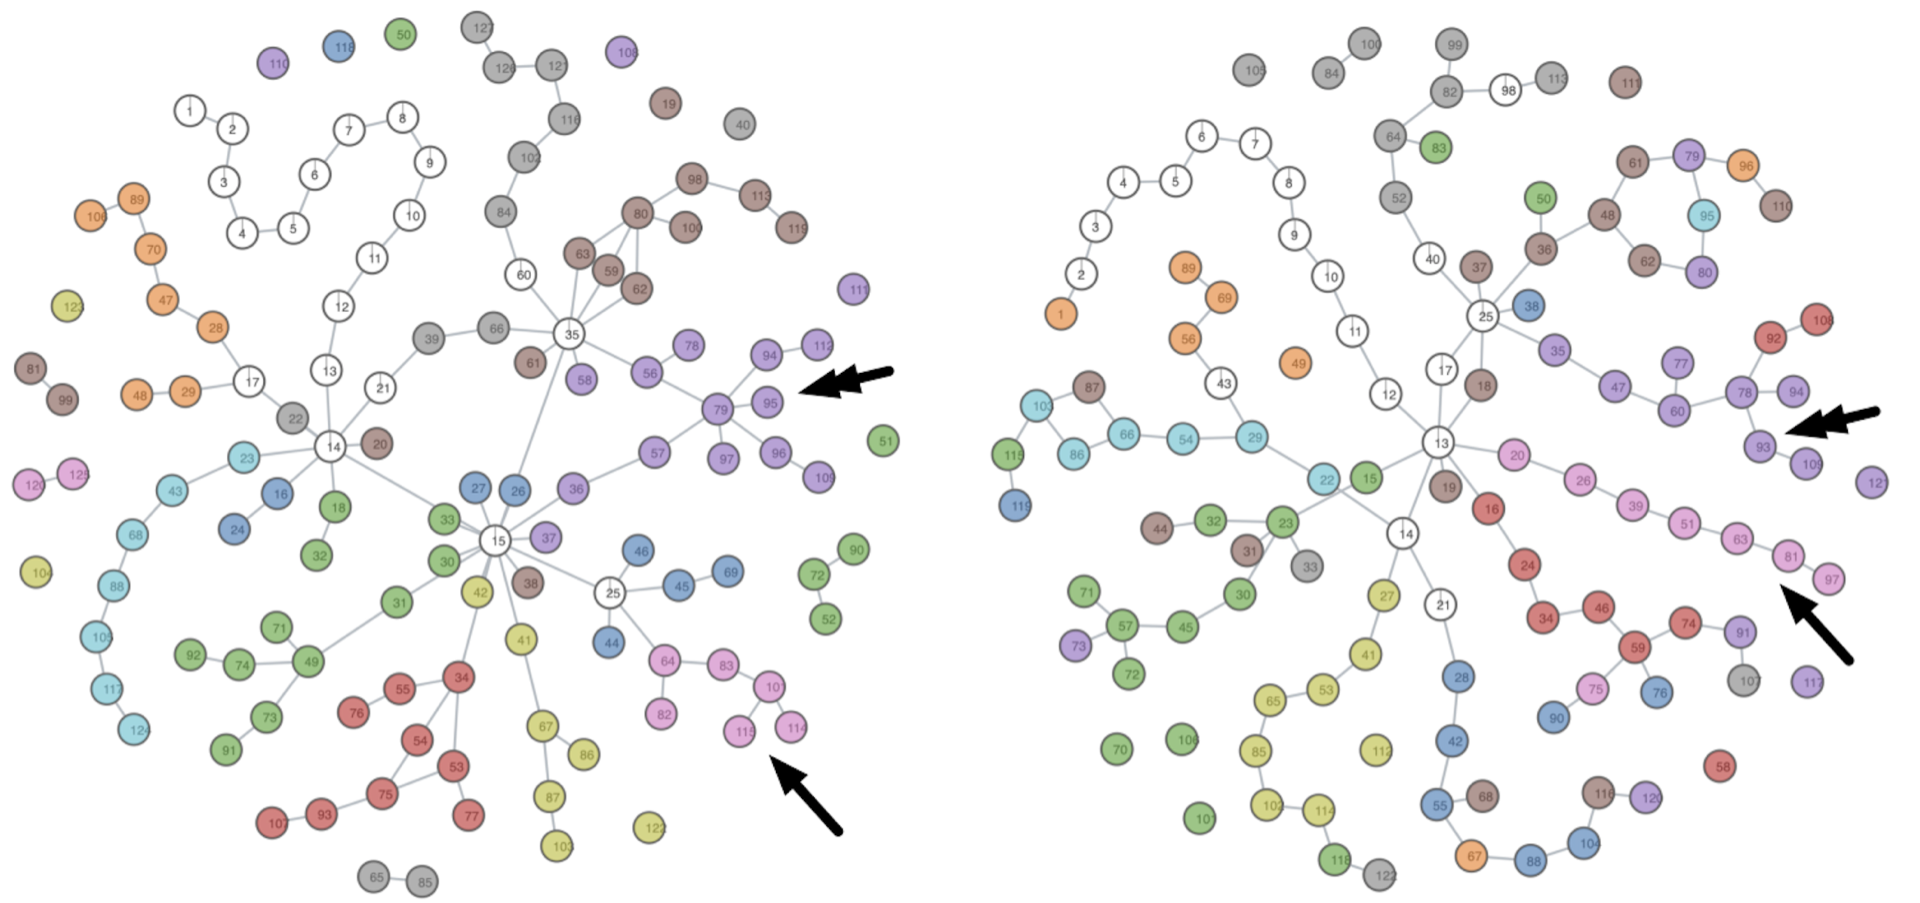
The mapper graph is a popular tool from topological data analysis that provides a graphical summary of point cloud data. It has been used to study data from cancer research, sports analytics, neurosciences, and machine learning. In particular, mapper graphs have been used recently to visualize the topology of high-dimensional artificial neural activations from convolutional neural networks and large language models. However, a key question that arises from using mapper graphs across applications is how to compare mapper graphs to study their structural differences. In this paper, we introduce a distance between mapper graphs using tools from optimal transport. We demonstrate the utility of such a distance by studying the topological changes of neural activations across convolutional layers in deep learning, as well as by capturing the loss of structural information for a multiscale mapper.