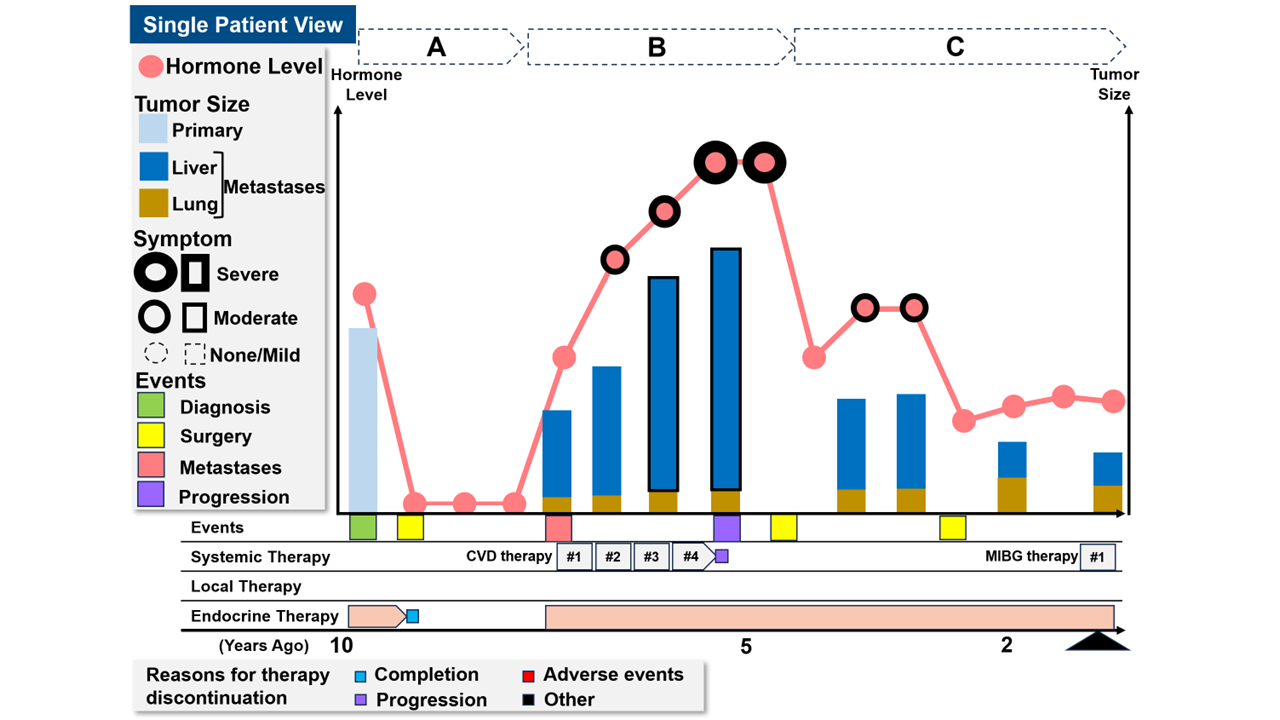
Clinical Issues and Suggestions: Dashboard Visualization of the Trajectory of Patients with Malignant Hormone-Producing Tumors for Precision Medicine
Masaki Uchihara, Akiyo Tanabe, Hiroshi Kajio
Room: 104
2023-10-22T03:00:00ZGMT-0600Change your timezone on the schedule page
2023-10-22T03:00:00Z
Keywords
Personalized medicine, Patient-generated health data, Physician-patient communication
Abstract
Metastatic hormone-producing tumors have characteristics of both tumors and endocrine disorders with many time-series parameters. Therefore, making treatment decisions is often challenging. Data visualization methods have recently been developed to visualize time series, single or multiple pieces of information, and complex patient information. We focused on metastatic pheochromocytoma and paraganglioma and summarized the clinical needs and dashboard data visualization ideas for precision medicine.