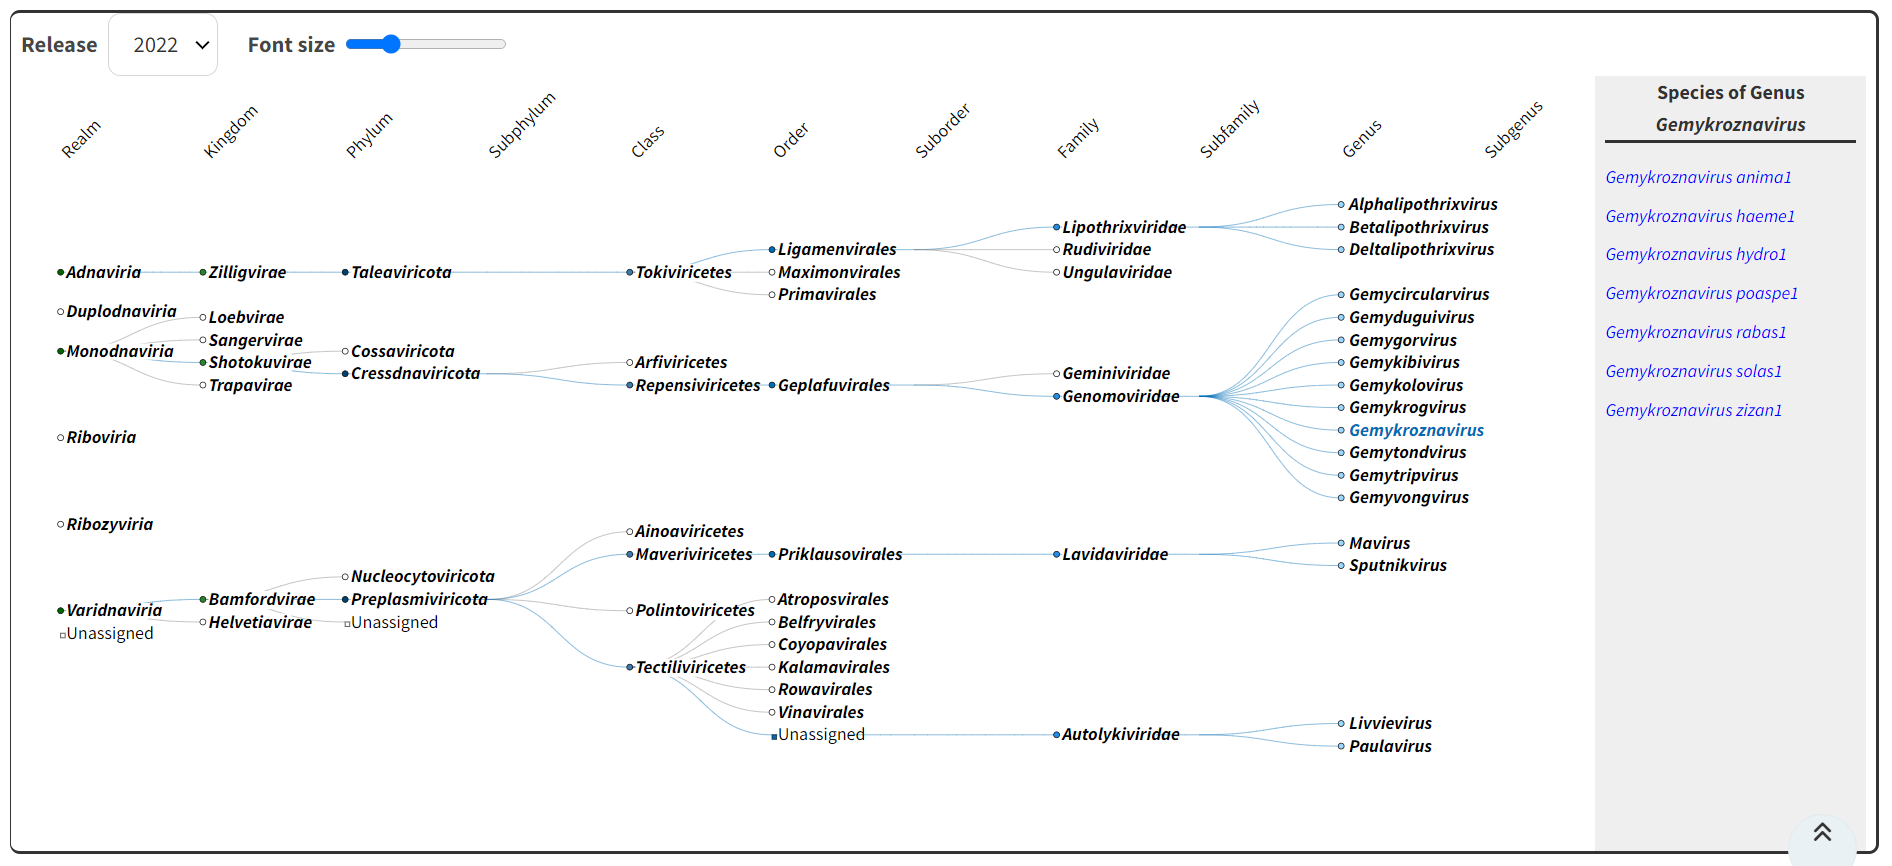
Scalable, interactive and hierarchical visualization of virus taxonomic data
Kashyap Balakavi, Rushitha Janga, Ahmedur Rahman Shovon, Don Dempsey, Elliot Lefkowitz, sidharth kumar
Room: 104
2023-10-22T03:00:00ZGMT-0600Change your timezone on the schedule page
2023-10-22T03:00:00Z
Keywords
Life Sciences, Health, Medicine, Biology, Bioinformatics, Genomics
Abstract
The International Committee on Taxonomy of Viruses (ICTV) maintains a database of virus taxonomy, including records from 1971 up to the most recent release in 2022. Recent years have seen an increasing number of viruses, recording 11,273 distinct species in the latest report. Exploring this increasingly high number of species requires a custom data visualization approach that is both scalable and interactive. Our paper presents a structure-preserving, collapsible, node-link layout-based hierarchical visualization called the Visual Taxonomy Browser, for the virus taxonomy dataset. Developed in collaboration with microbiologists, our visualization improves over the existing Taxonomy Browser3 which is a stacked bar-based approach that lacks scalability and does not preserve the underlying topological structure of the taxonomy. The Visual Taxonomy Browser has been deployed on the ICTV website and has been serving virologists from across the world.