Exploring Annotation Strategies in Professional Visualizations: Insights from Prominent US News Portals
Md Dilshadur Rahman, Ghulam Jilani Quadri, Paul Rosen
Room: 105
2023-10-22T03:00:00ZGMT-0600Change your timezone on the schedule page
2023-10-22T03:00:00Z
Keywords
Annotations, Visualization design, Visualization techniques, Professional practices
Abstract
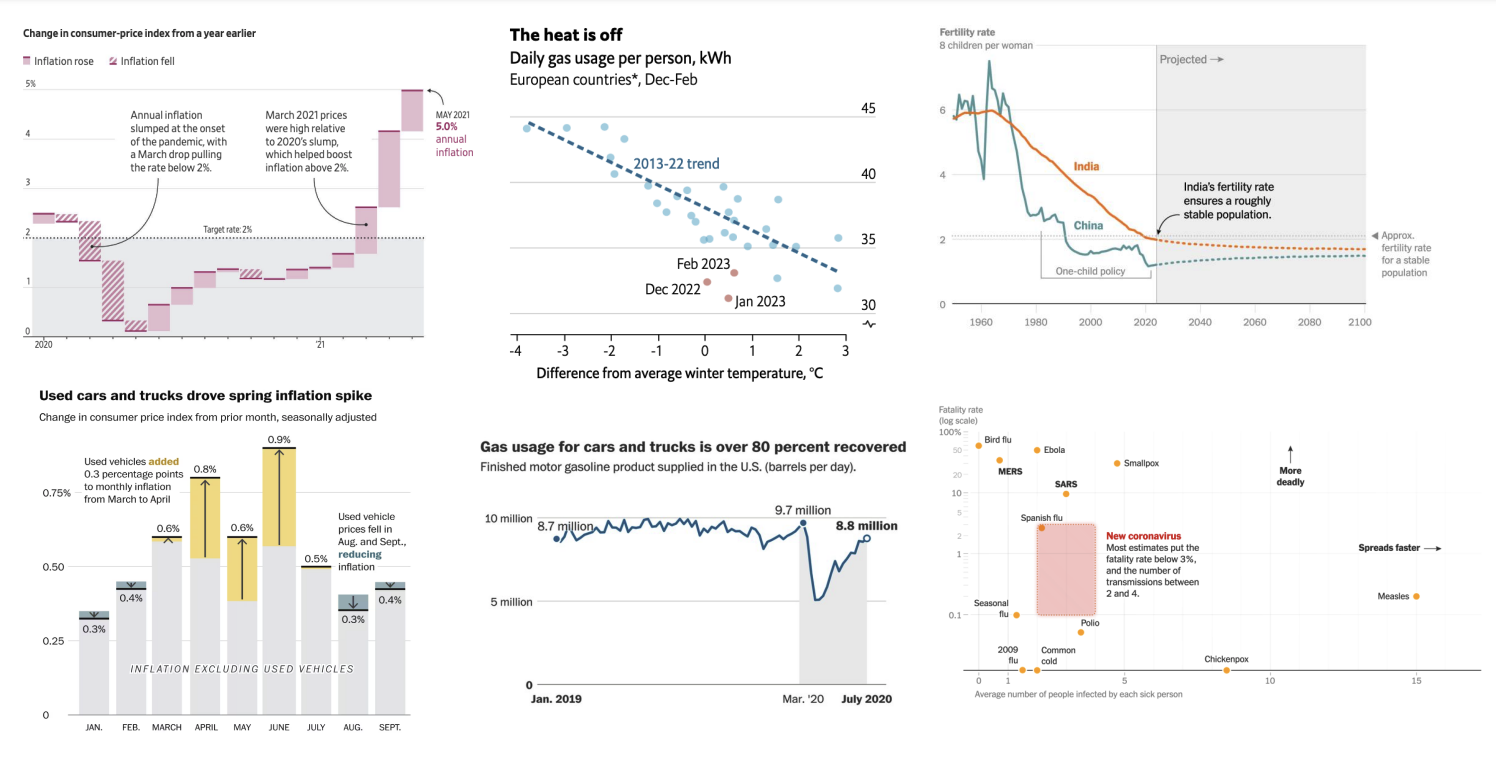
Annotations play a vital role in visualizations, providing valuable insights and focusing attention on critical visual elements.This study analyzes a curated corpus of 72 professionally designed static charts with annotations from prominent US news portals includingThe New York Times, The Economists, The Wall Street Journal, and The Washington Post. The analysis employed a qualitative approach involving identifying annotation types, assessing their frequency, exploring annotation combinations, categorizing text quantity, and examining the relationship between chart captions and annotations. The analysis reveals common patterns in annotation strategies used by professionals, including extensive use of annotations aligned with chart captions, targeted highlighting and descriptive text within charts, strategic utilization of multiple annotations as ensembles, and emphasis on article-related numerical values. These findings provide valuable guidance for improving annotation practices, tools, and methodologies, enhancing data comprehension and communication in visualizations.