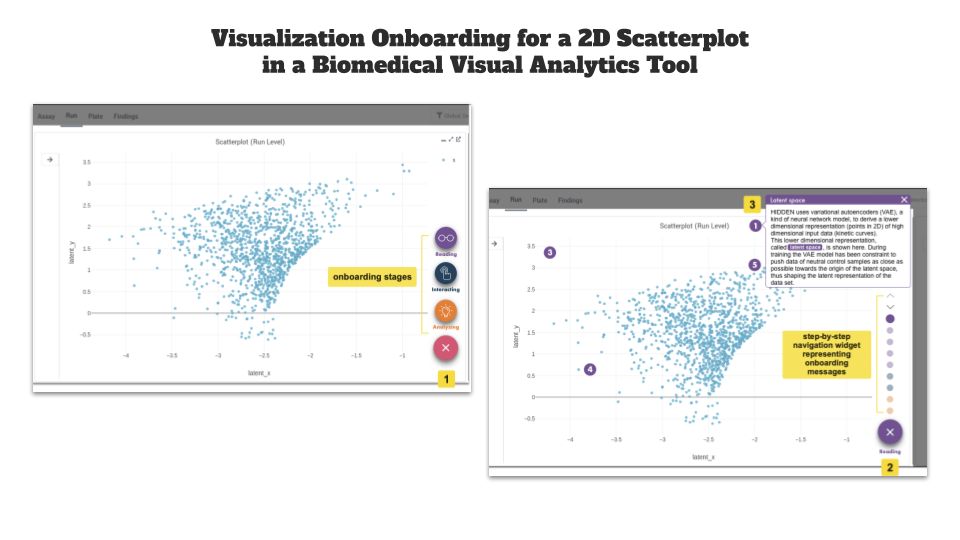
Design of Visualization Onboarding Concepts for a 2D Scatterplot in a Biomedical Visual Analytics Tool
Christina Stoiber, Daniela Moitzi, Holger Stitz, Dominic Girardi, Marc Streit, Wolfgang Aigner
Room: 105
2023-10-22T03:00:00ZGMT-0600Change your timezone on the schedule page
2023-10-22T03:00:00Z
Keywords
Human-centered computing—Visualization— Visualization design and evaluation method;
Abstract
Biomedical research is highly data-driven. Domain experts need to learn how to interpret complex data visualizations to gain insights. They often need help interpreting data visualizations as they are not part of their training. Integrating visualization onboarding concepts into visual analytics (VA) tools can support users in interpreting, reading, and extracting information from visual presentations. In this paper, we present the design of the onboarding concept for an interactive VA tool to analyze large scaled biological data, particularly high-throughput screening (HTS) data. We evaluated our onboarding design by conducting a cognitive walkthrough and interviews with thinking aloud. We also collected data on domain experts’ visualization literacy. The results of the cognitive walkthrough showed that domain experts positively commented on the onboarding design and proposed adjusting smaller aspects. The interviews showed that domain experts are well-trained in interpreting basic visualizations (e.g., scatterplot, bar chart, line chart). However, they need support correctly interpreting the data visualized in the scatterplot, as they are new to them. Another important insight was fitting the onboarding messages into the domain’s language.