Visualising category recoding and numeric redistributions
Cynthia A Huang
Room: 110
2023-10-22T22:00:00ZGMT-0600Change your timezone on the schedule page
2023-10-22T22:00:00Z
Abstract
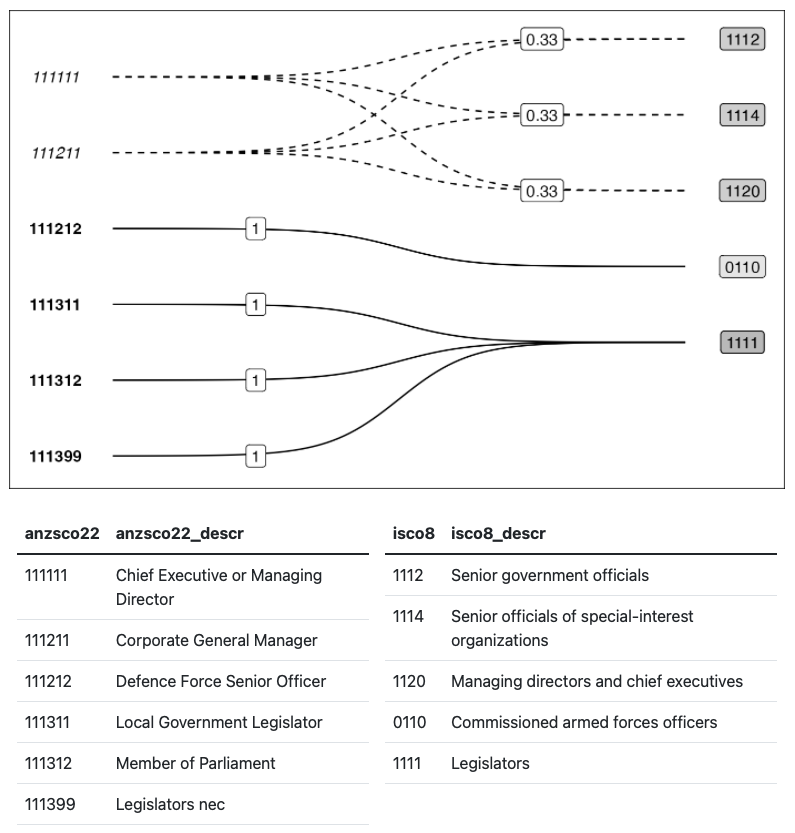
This paper proposes graphical representations of data and rationale provenance in workflows that convert both category labels and associated numeric data between distinct but semantically related taxonomies. We motivate the graphical representations with a new task abstraction, the cross-taxonomy transformation, and associated graph-based information structure, the crossmap. The task abstraction supports the separation of category recoding and numeric redistribution decisions from the specifics of data manipulation in ex-post data harmonisation. The crossmap structure is illustrated using an example conversion of numeric statistics from a country-specific taxonomy to an international classification standard. We discuss the opportunities and challenges of using visualisation to audit and communicate cross-taxonomy transformations and present candidate graphical representations.