Adjusting Point Size to Facilitate More Accurate Correlation Perception in Scatterplots
Gabriel Strain, Andrew James Stewart, Paul A Warren, Caroline Jay
Room: 109
2023-10-23T03:00:00ZGMT-0600Change your timezone on the schedule page
2023-10-23T03:00:00Z
Abstract
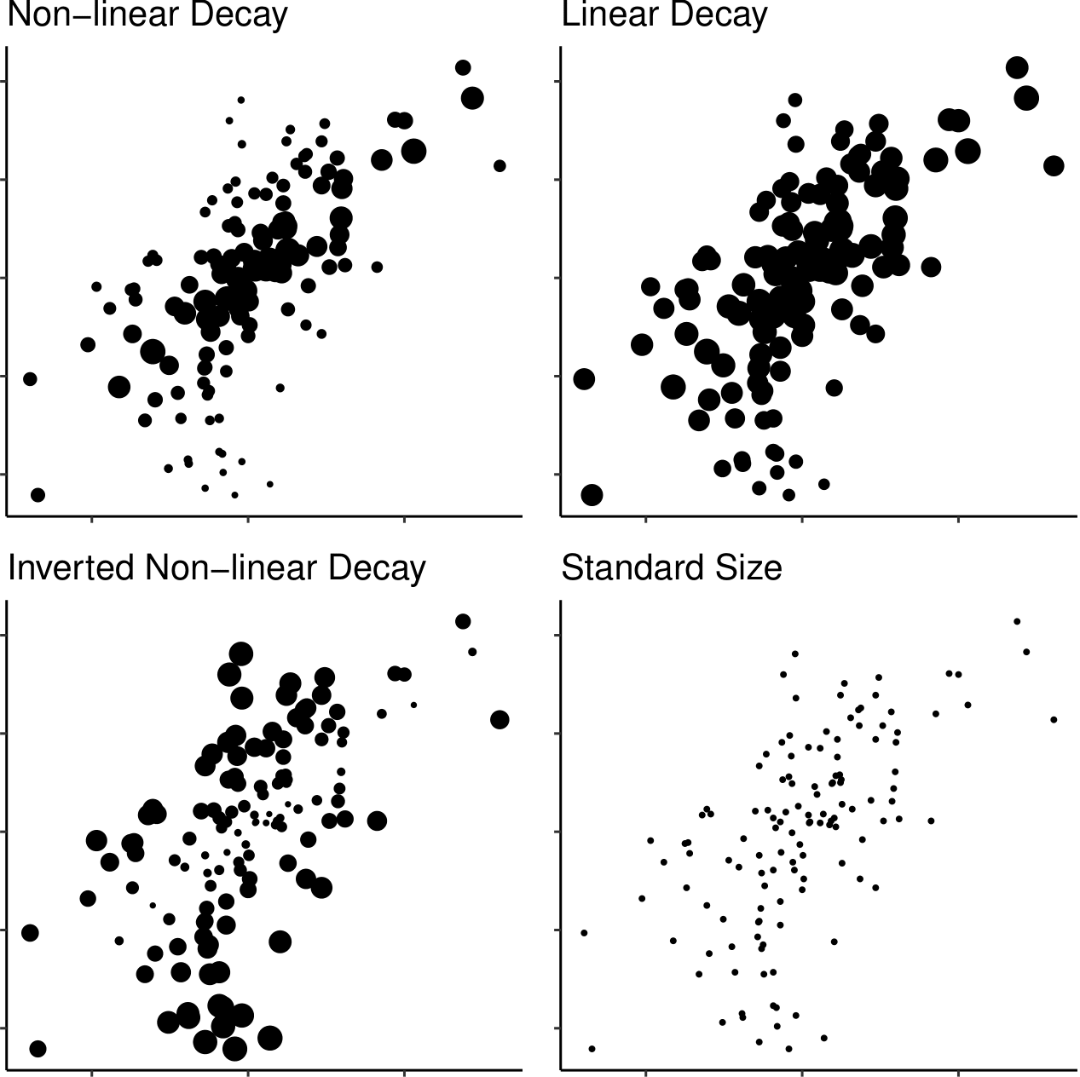
Viewers consistently underestimate correlation in positively correlated scatterplots. We use a novel data point size manipulation to correct for this bias. In a high-powered and fully reproducible study, we demonstrate that decreasing the size of a point on a scatterplot as a function of its distance from the regression line is able to correct for a systematic perceptual bias long present in the literature. We recommend the implementation of our technique when designing scatterplots that aim to communicate positive correlations.