The Role of Visualization in Genomics Data Analysis Workflows: The Interviews
Sehi L'Yi, Qianwen Wang, Nils Gehlenborg
Room: 104
2023-10-25T04:45:00ZGMT-0600Change your timezone on the schedule page
2023-10-25T04:45:00Z
Fast forward
Full Video
Keywords
Large-Scale Data Techniques ; Life Sciences, Health, Medicine, Biology, Bioinformatics, Genomics ; Guidelines ; Process/Workflow Design ; Human-Subjects Qualitative Studies
Abstract
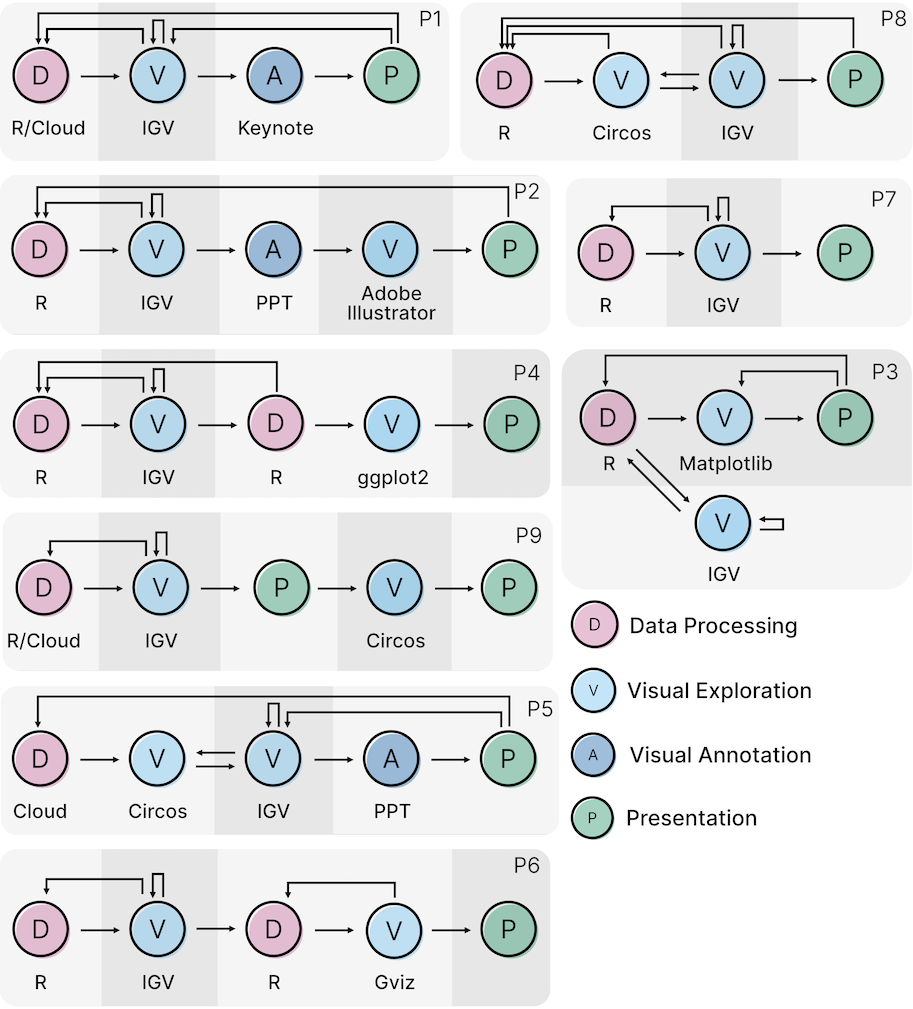
The diversity of genome-mapped data and analysis tasks makes it challenging for a single visualization tool to fulfill all visualization needs. To design a visualization tool that supports various genomics workflows of users, it is critical to first gain insights into the diverse workflows and the limitations of existing genomics tools for supporting them. In this paper, we conducted semi-structured interviews (N=9) to understand the role of visualization in genomics data analysis workflows. Our main goals were to identify various genomics workflows, from data analysis to visual exploration and presentation, and to observe challenges that genomics analysts encounter in these workflows when using existing tools. Through the interviews, we found several unique characteristics of genomics workflows, such as the use of multiple visualization tools and many repetitive tasks, which can significantly affect the overall performance. Based on our findings, we discuss implications for designing effective visualization authoring tools that tightly support genomics workflows, such as supporting automation and reproducibility.