Vis-SPLIT: Interactive Hierarchical Modeling for mRNA Expression Classification
Braden Roper, James C. Mathews, Saad Nadeem, Ji Hwan Park
Room: 104
2023-10-25T04:54:00ZGMT-0600Change your timezone on the schedule page
2023-10-25T04:54:00Z
Fast forward
Full Video
Keywords
Human-centered computing—Visualization—Visualization application domains—Visual analytics
Abstract
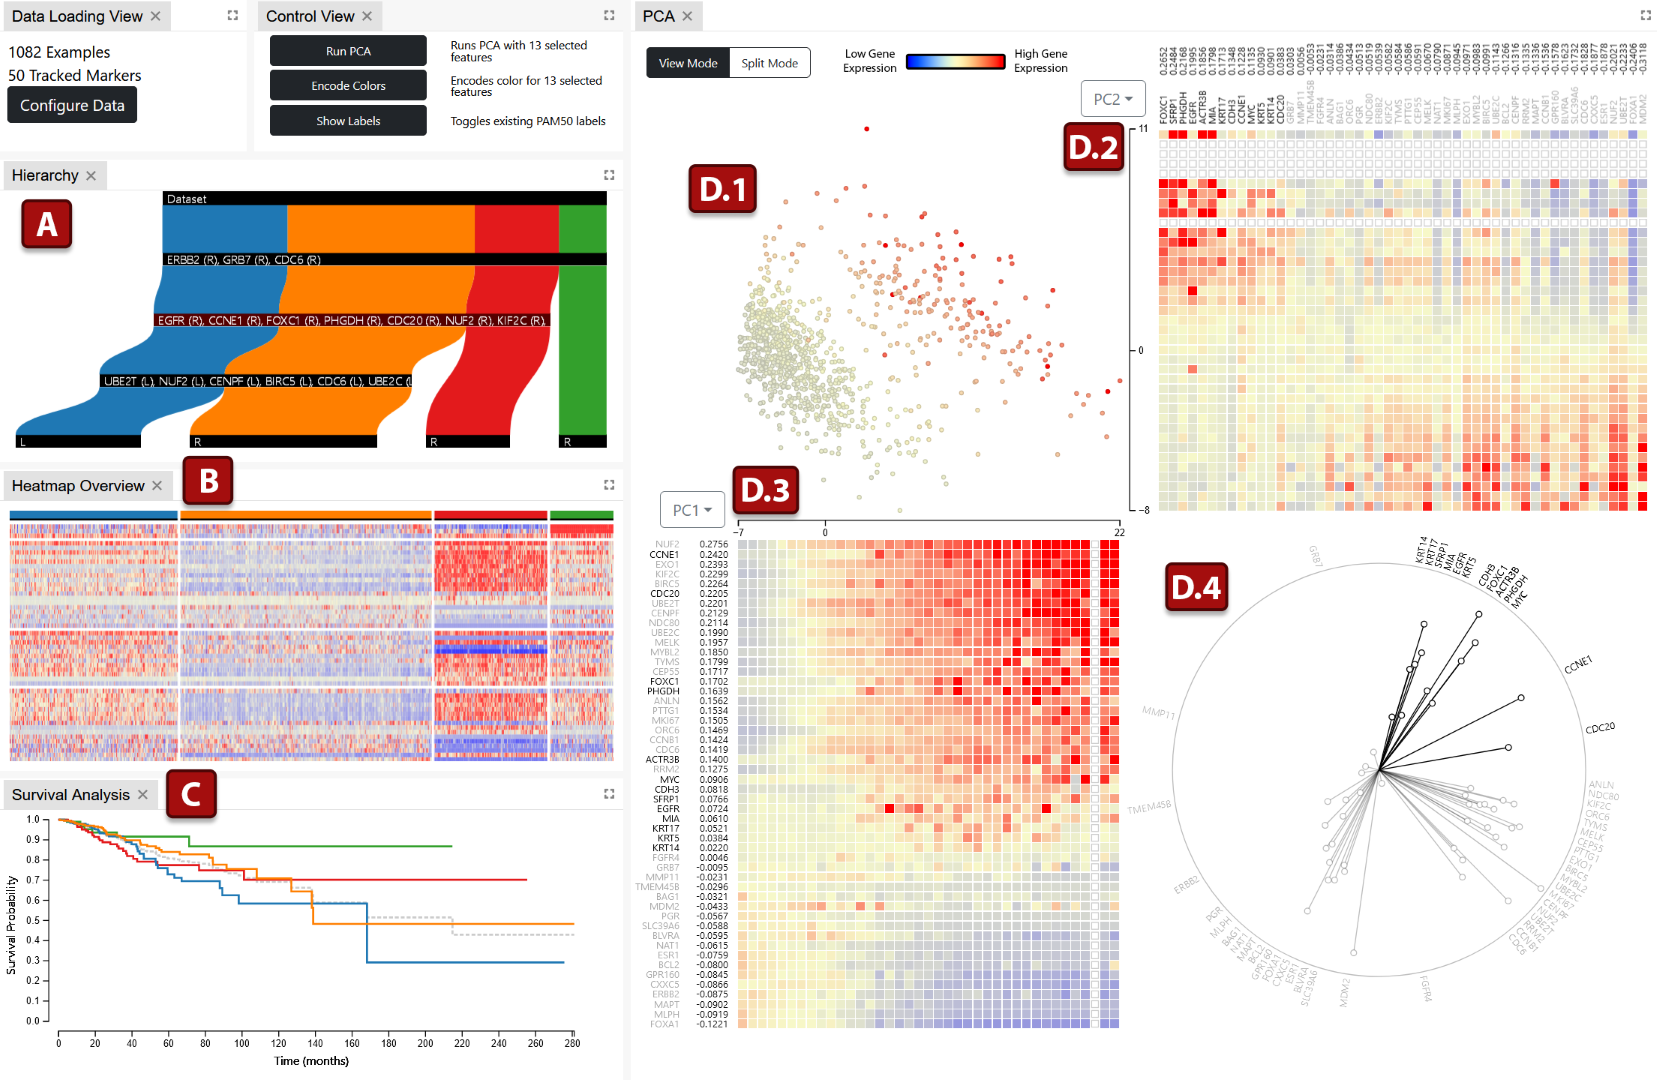
We propose an interactive visual analytics tool, Vis-SPLIT, for partitioning a population of individuals into groups with similar gene signatures. Vis-SPLIT allows users to interactively explore a dataset and exploit visual separations to build a classification model for specific cancers. The visualization components reveal gene expression and correlation to assist specific partitioning decisions, while also providing overviews for the decision model and clustered genetic signatures. We demonstrate the effectiveness of our framework through a case study and evaluate its usability with domain experts. Our results show that Vis-SPLIT can classify patients based on their genetic signatures to effectively gain insights into RNA sequencing data, as compared to an existing classification system.