Topological Analysis of Ensembles of Hydrodynamic Turbulent Flows, an Experimental Study
Florent Nauleau, Fabien Vivodtzev, Thibault Bridel-Bertomeu, Héloïse Beaugendre, Julien Tierny
View presentation:2022-10-16T19:25:00ZGMT-0600Change your timezone on the schedule page
2022-10-16T19:25:00Z
The live footage of the talk, including the Q&A, can be viewed on the session page, LDAV: Topology & Ensembles.
Abstract
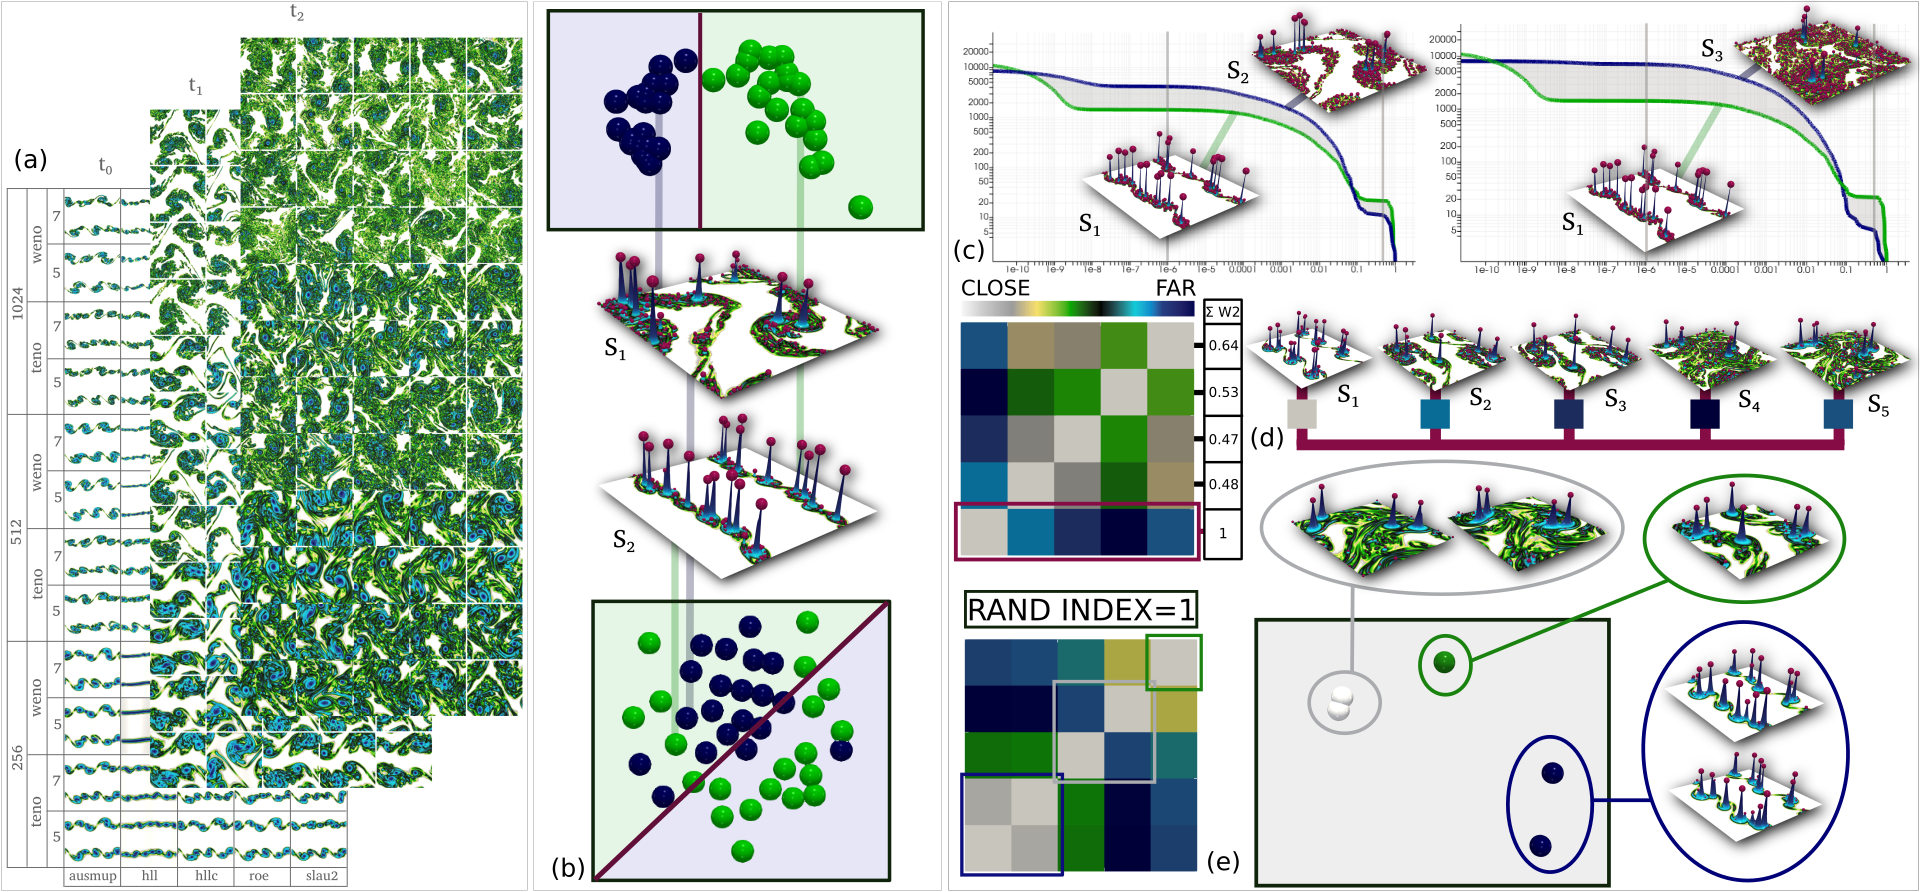
This application paper presents a comprehensive experimental evaluation of the suitability of Topological Data Analysis (TDA) for the quantitative comparison of turbulent flows. Specifically, our study documents the usage of the persistence diagram of the maxima of flow enstrophy (an established vorticity indicator), for the topological representation of 180 ensemble members, generated by a coarse sampling of the parameter space of five numerical solvers. We document five main hypotheses reported by domain experts, describing their expectations regarding the variability of the flows generated by the distinct solver configurations. We contribute three evaluation protocols to assess the validation of the above hypotheses by two comparison measures: (i) a standard distance used in distance between persistence diagrams (the L2 -Wasserstein metric). Extensive experiments on the input ensemble demonstrate the superiority of the topological distance (ii) to report as close to each other flows which are expected to be similar by domain experts, due to the configuration of their vortices. Overall, the insights reported by our study bring an experimental evidence of the suitability of TDA for representing and comparing turbulent flows, thereby providing to the fluid dynamics community confidence for its usage in future work. Also, our flow data and evaluation protocols provide to the TDA community an application-approved benchmark for the evaluation and design of further topological distances.