Angular-based Edge Bundled Parallel Coordinates Plot for the Visual Analysis of Large Ensemble Simulation Data
Keita Watanabe, Naohisa Sakamoto, Jorji Nonaka, Yasumitsu Maejima
View presentation:2022-10-16T19:50:00ZGMT-0600Change your timezone on the schedule page
2022-10-16T19:50:00Z
The live footage of the talk, including the Q&A, can be viewed on the session page, LDAV: Topology & Ensembles.
Abstract
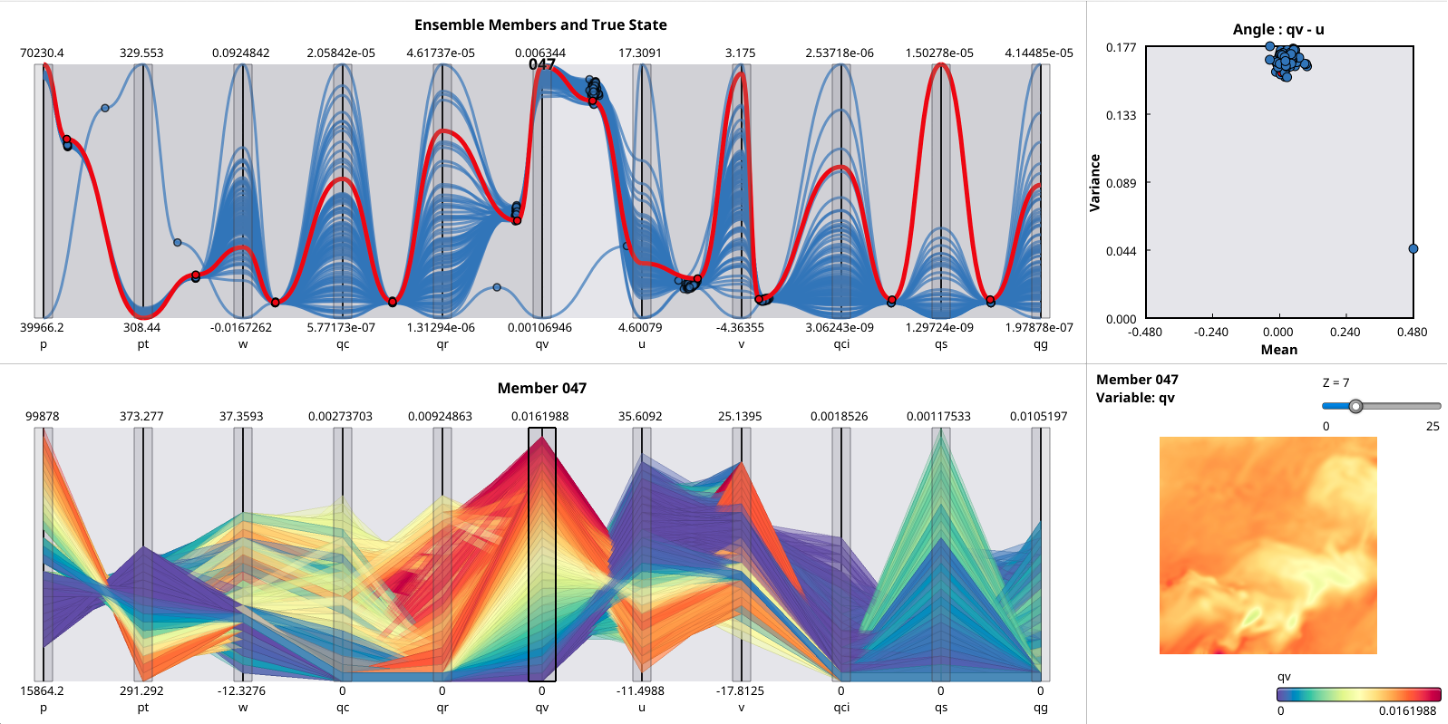
With the continuous increase in the computational power and resources of modern high-performance computing (HPC) systems, large-scale ensemble simulations have become widely used in various fields of science and engineering, and especially in meteorological and climate science. It is widely known that the simulation outputs are large time-varying, multivariate, and multivalued datasets which pose a particular challenge to the visualization and analysis tasks. In this work, we focused on the widely used Parallel Coordinates Plot (PCP) to analyze the interrelations between different parameters, such as variables, among the members. However, PCP may suffer from visual cluttering and drawing performance with the increase on the data size to be analyzed, that is, the number of polylines. To overcome this problem, we present an extension to the PCP by adding B\'{e}zier curves connecting the angular distribution plots representing the mean and variance of the inclination of the line segments between parallel axes. The proposed Angular-based Parallel Coordinates Plot (APCP) is capable of presenting a simplified overview of the entire ensemble data set while maintaining the correlation information between the adjacent variables. To verify its effectiveness, we developed a visual analytics prototype system and evaluated by using a meteorological ensemble simulation output from the supercomputer Fugaku.